LogicMonitor integration for Splunk On-Call 🔗
LogicMonitor replaces multiple monitoring solutions. It monitors everything in your datacenter: servers (physical, virtual, or cloud based), applications (web, mail, database, virtualization), networking gear, storage arrays, load balancers, UPS, etc, using a single web portal. The Splunk On-Call integration with LogicMonitor uses the REST API and requires that you have implemented LogicMonitor in your infrastructure.
Requirements 🔗
This integration is compatible with the following versions of Splunk On-Call:
Starter
Growth
Enterprise
Note
To make sure incidents are resolved correctly, select static fields for the Critical and Resolved subject lines.
Splunk On-Call configuration 🔗
In Splunk On-Call, select Settings, Alert Behavior, Integrations, LogicMonitor.
If the integration is not active, select Enable Integration to generate your endpoint URL. Make sure to replace the $routing_key section with the routing key you want to use.
LogicMonitor configuration 🔗
From the main dashboard select Settings, Integrations and select Add.
In the dialog, select Custom HTTP Delivery.
Fill in the following values:
Name: Splunk On-Call
Description: Send alert information to Splunk On-Call
Select Use different URLs or data formats to notify on various alert activity.
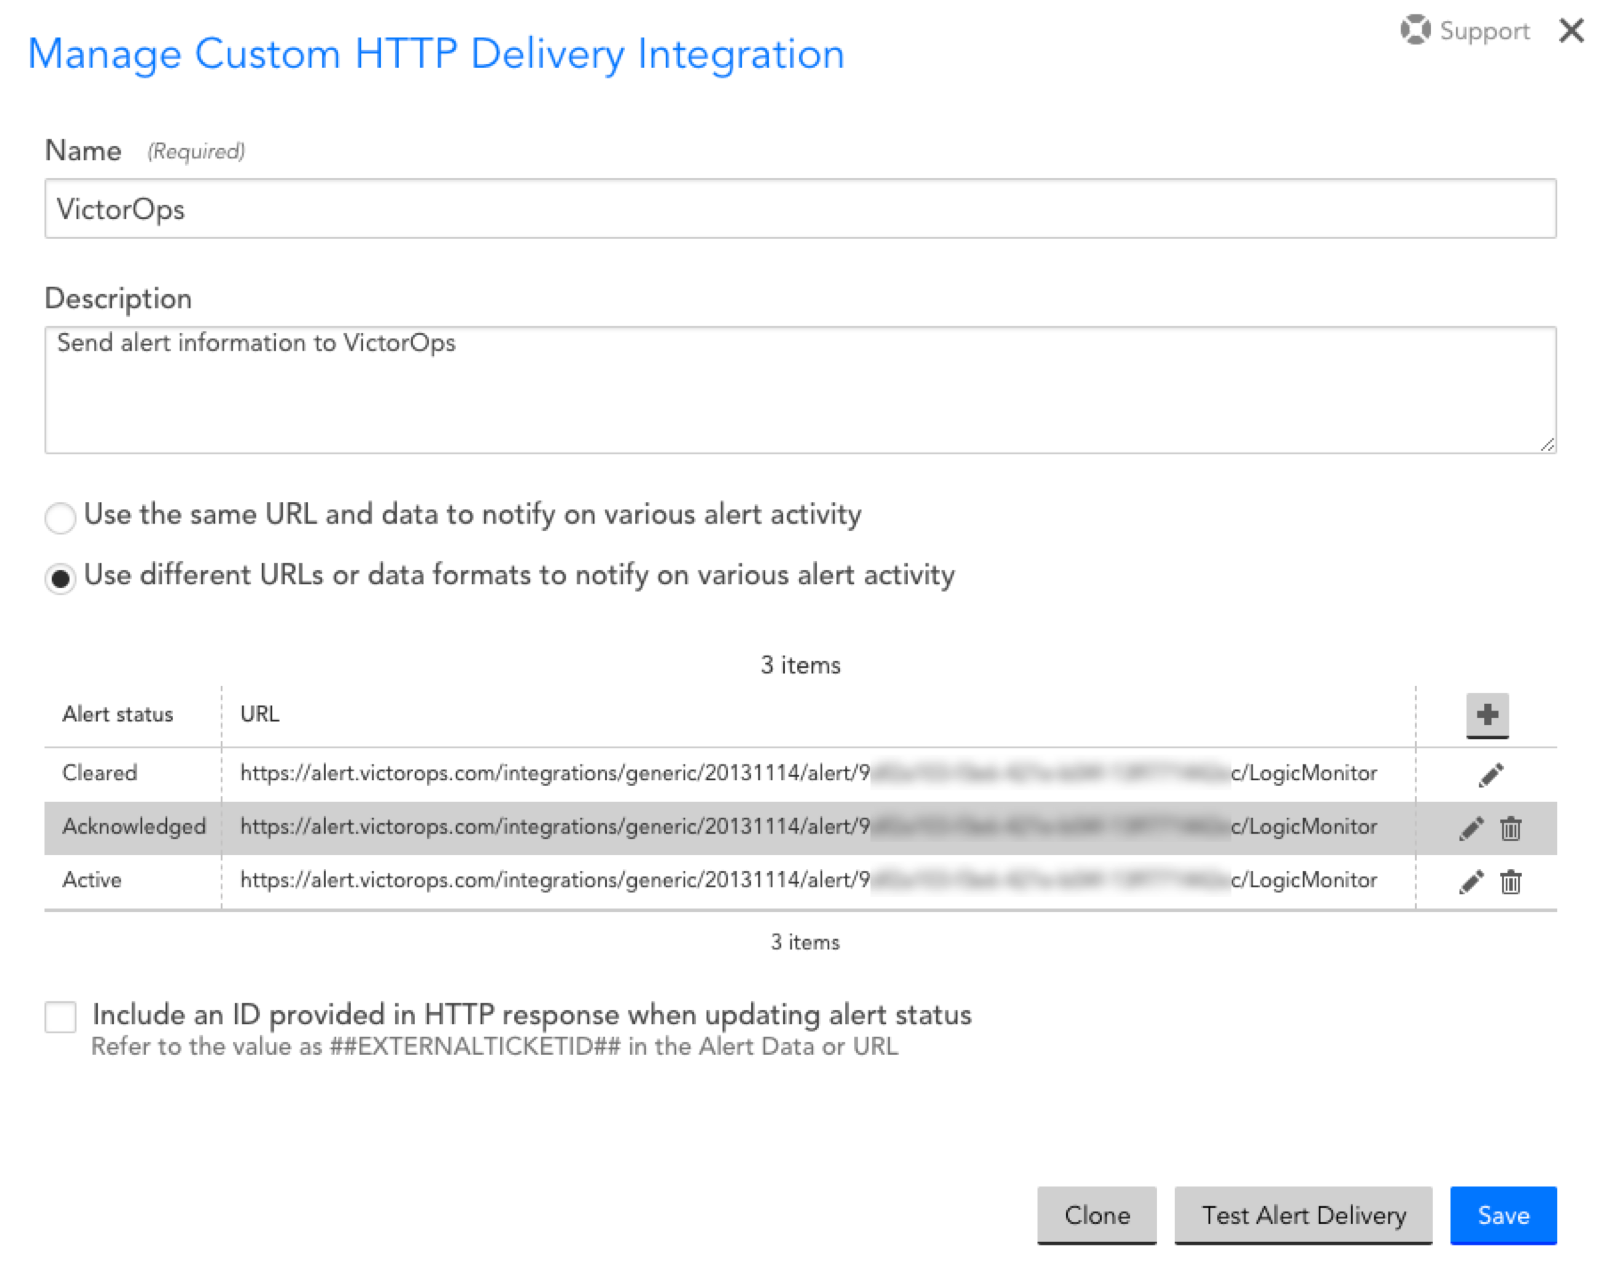
Create an alert method for each alert activity. Most of the configuration is the same except for two settings: the alert activity and its corresponding message type defined in the post body. To do this, create separate configurations for each type of alert status.
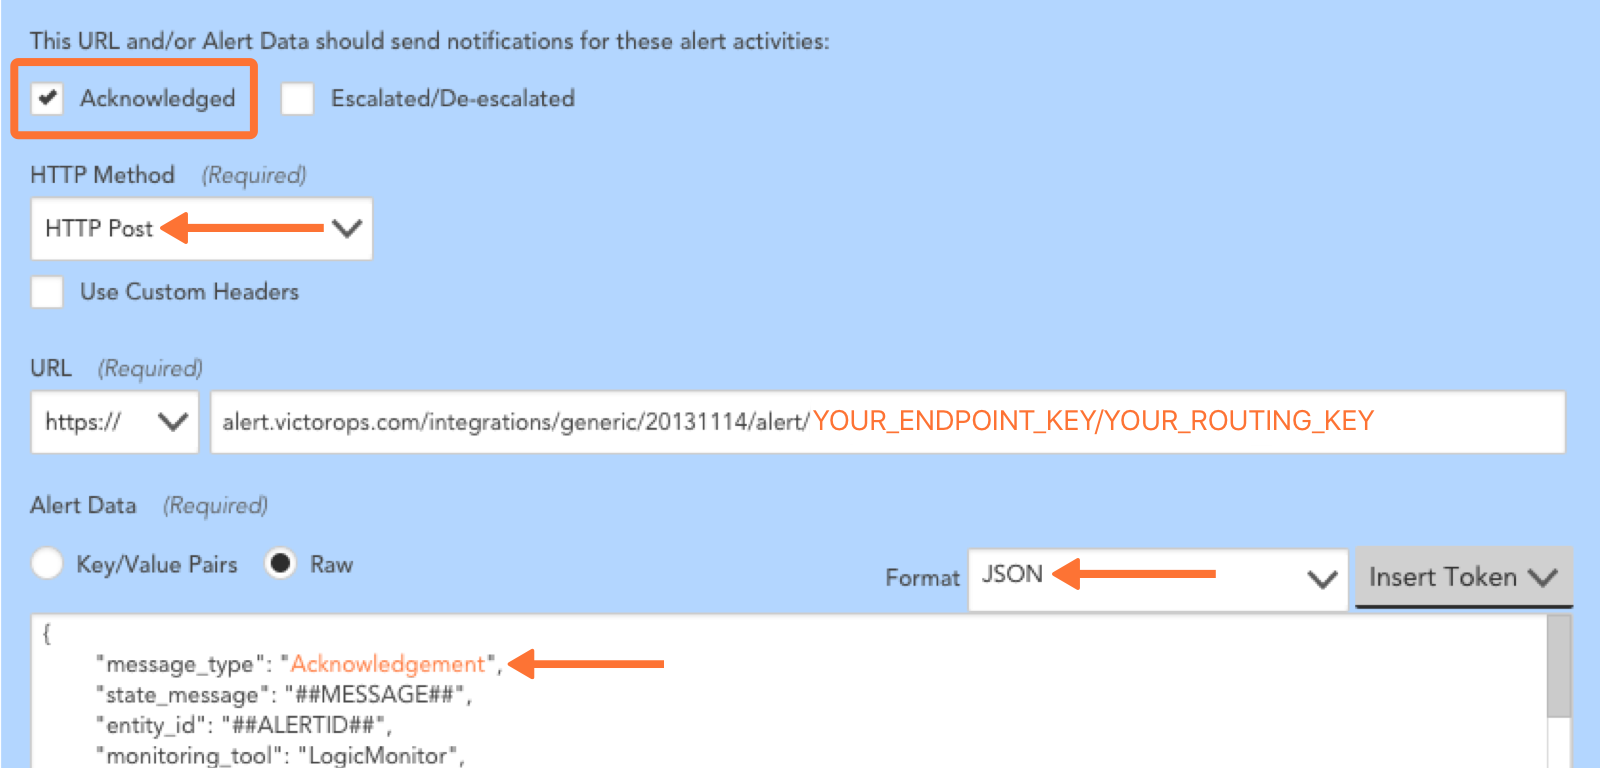
HTTP Method: HTTP POST
URL:
https://alert.victorops.com/integrations/generic/20131114/alert/YOUR_API_KEY_HERE/YOUR_ROUTING_KEY_HEREAlert Data:
Select Raw`
Format: JSON
For the Alert Data paste the following message. Note that this sample assigns a value of
CRITICALto themessage_type:{ “message_type”:“CRITICAL”, “state_message”:“##MESSAGE##”, “entity_id”:“##ALERTID##”, “monitoring_tool”:“LogicMonitor”, “entity_display_name”:“##LEVEL## alert on ##HOST##”, “GROUP”:“##GROUP##”, “START”:“##START##”, “DESCRIPTION”:“##SERVICEDESCRIPTION##”, “SERVICE_CHECKPOINT”:“##CHECKPOINT##”, “SERVICE_GROUP”:“##SERVICEGROUP##”, “CLIENT_URL”:“https://##COMPANY##.logicmonitor.com”, “ALERT_URL”:“##AlertDetailURL##”, “ADMIN”:“##ADMIN##”, “ALERTID”:“##ALERTID##”, “ALERTTYPE”:“##ALERTTYPE##”, “ALERTSTATUS”:“##ALERTSTATUS##”, “CMDLINE”:“##CMDLINE##”, “DATAPOINT”:“##DATAPOINT##”, “DATASOURCE”:“##DATASOURCE##”, “DPDESCRIPTION”:“##DPDESCRIPTION##”, “DSIDESCRIPTION”:“##DSIDESCRIPTION##”, “DURATION”:“##DURATION##”, “EVENTCODE”:“##EVENTCODE##”, “EXITCODE”:“##EXITCODE##”, “FACILITY”:“##FACILITY##”, “GENERALCODE”:“##GENERALCODE##”, “HOST”:“##HOST##”, “INSTANCE”:“##INSTANCE##”, “LEVEL”:“##LEVEL##”, “LOGFILE”:“##LOGFILE##”, “MESSAGE”:“##MESSAGE##”, “SOURCENAME”:“##SOURCENAME##”, “SPECIFICCODE”:“##SPECIFICCODE##”, “STARTEPOCH”:“##STARTEPOCH##”, “STDERR”:“##STDERR##”, “STDOUT”:“##STDOUT##”, “THRESHOLD”:“##THRESHOLD##”, “TRAPOID”:“##TRAPOID##”, “TYPE”:“##TYPE##”, “VALUE”:“##VALUE##” }
Repeat steps 1 through 4 for an alert status of Acknowledged and again for Cleared. For each, within the Alert Data change the message_type field to reflect the alert status. Map the field as follows and refer to the screenshot for clarification:
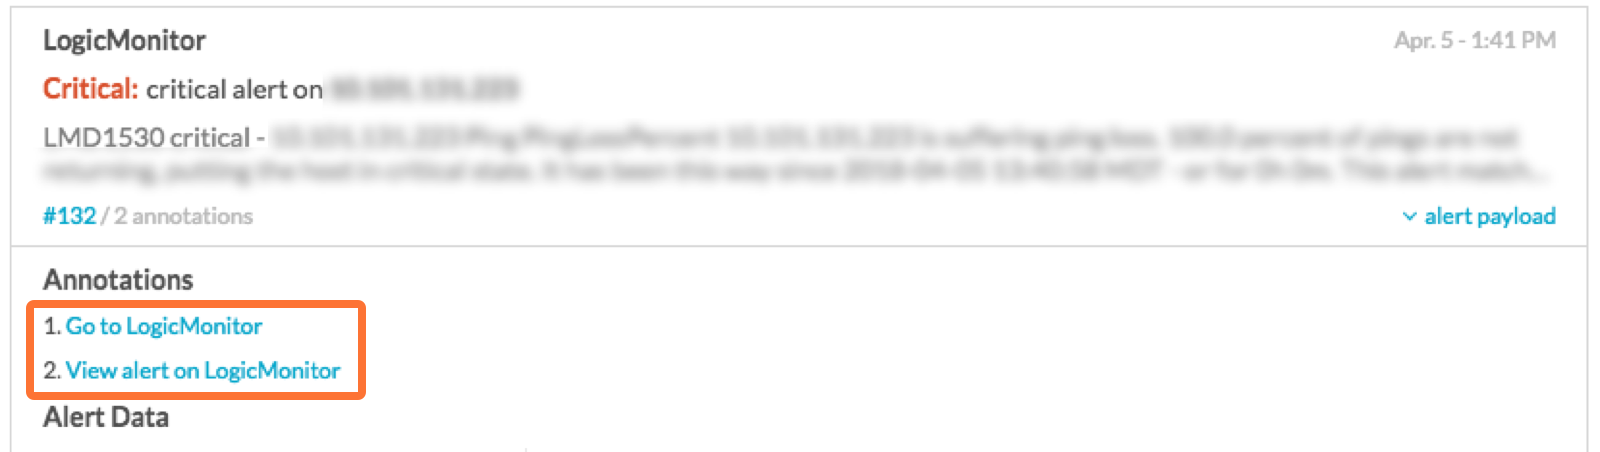
Add annotations to alerts 🔗
Using the previous configuration, the alert URL and client URL are sent over as fields. To present these fields as highly accessible annotations, implement the following Rules Engine rules.
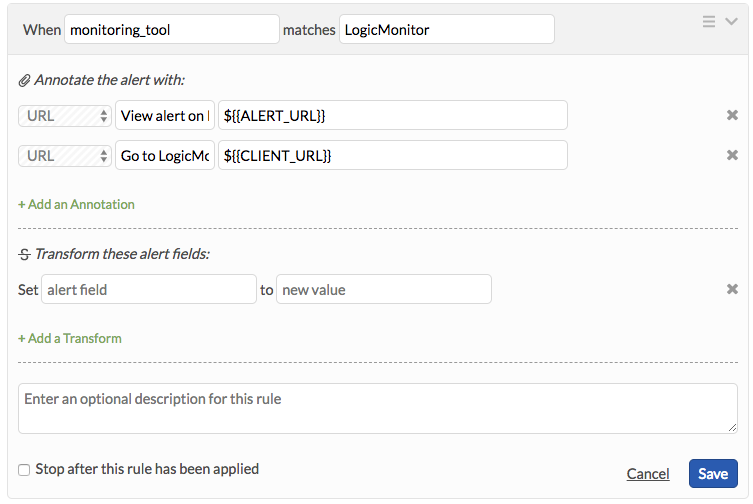
When
monitoring_toolmatchesLogicMonitor.
Annotate the alert with:
URL, View alert on LogicMonitor,
${{ALERT_URL}}URL, Go to LogicMonitor,
${{CLIENT_URL}}
After you save, direct links appears in the incident and alert cards to both URLs.