REST Endpoint integration for Splunk On-Call 🔗
The REST Endpoint allows you to send customized alerts and incident details into the Splunk On-Call timeline. Alerts get sent into the Splunk On-Call incident workflow with fields such as message_type, entity_id, and state_message. As alerts come into Splunk On-Call, they are routed directly to the proper person or team with incident details that give the on-call responder more context.
The Splunk On-Call REST Endpoint accepts alerts from any source using an HTTPS POST request in JSON format. As long as you can configure the content of the request, you can trigger, acknowledge, or resolve incidents in Splunk On-Call.
Activate the REST Endpoint Integration 🔗
In Splunk On-Call, select Integrations, 3rd Party Integrations, REST - Generic.
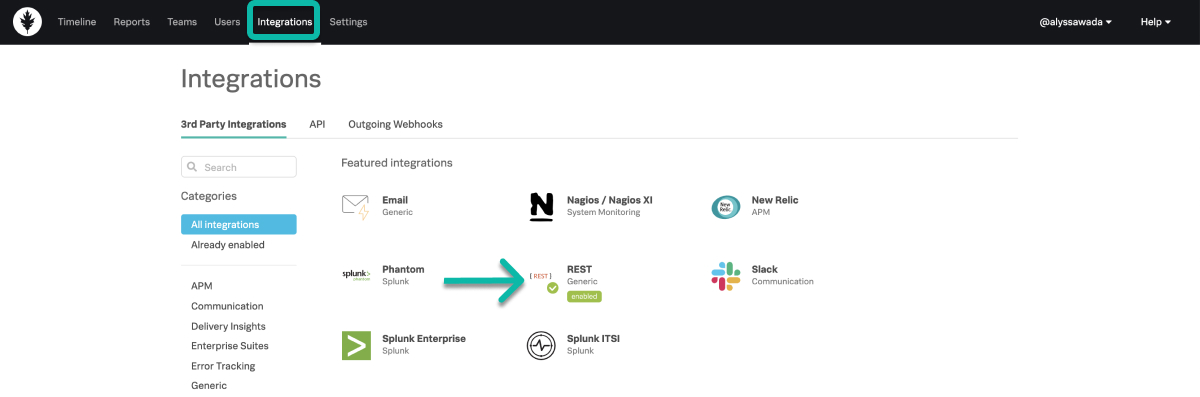
If the REST endpoint integration isn’t activated, select Enable to generate your endpoint destination URL.
Note
The REST endpoint is different than the Splunk On-Call API and is the preferred method to create incidents.
REST Endpoint Integration routing key 🔗
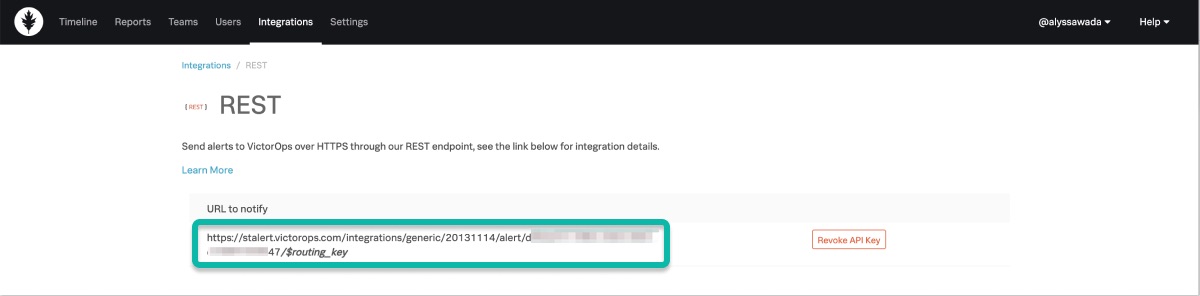
The routing key used for this integration is included in the destination URL. Everything after the final forward slash must be replaced with your key. For example, assuming a routing_key value of database:
...36437/$routing_key becomes ...36437/database
You can set up and associate routing keys in Splunk On-Call by selecting Settings, Routing Keys.
For more information on routing keys and best practices, see Create Routing Keys in Splunk On-Call.
Recommended settings 🔗
While only message_type is required, the following fields help establish the workflow and lifecycle of an incident in Splunk On-Cal. For more information on different fields that Splunk On-Call supports, see Incident fields Glossary.
Setting |
Comment |
|---|---|
|
|
|
ID of the Incident. This field is the identity of the incident and must remain the same throughout the life-cycle of an incident. Make sure you use the same |
|
Display Name in the UI and Notifications. This field allows you to give custom, human-friendly, summary of your incidents without affecting the life-cycle workflow. |
|
Verbose message field. This field has a high character limit and is intended for a long, verbose, explanation of the problem. This field is included in some notifications: full content in email, truncated version in push, phone, or SMS notifications following the |
Expected Responses 🔗
Success messages show the result and the entity_id of the incident. For example:
{ “result”:“success”, “entity_id”:“Your entity_id here” }
Failure messages show the result as well as an error message explaining the reason for the failure. For example:
{ “result”:“failure”, “message”:“Missing fields: message_type” }
Example alerts 🔗
The following examples show several features of the integration.
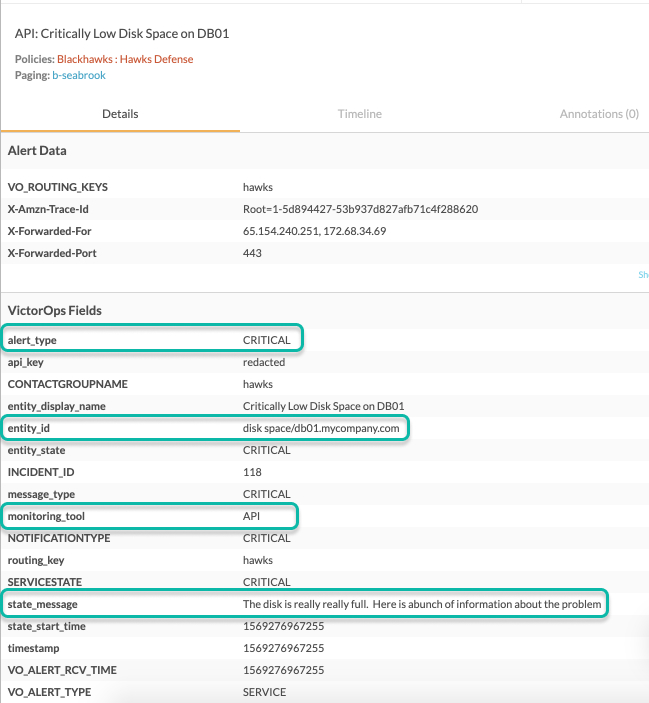
Trigger a critical incident 🔗
The following request opens a new incident:
{ “message_type”:“CRITICAL”, “entity_id”:“disk
space/db01.mycompany.com”, “entity_display_name”:“Critically Low Disk
Space on DB01”, “state_message”:“The disk is really really full. Here is
abunch of information about the problem” }
The response looks like the following:
{ “result” : “success”, “entity_id” : “disk space/db01.mycompany.com” }
The resulting incident in Splunk On-Call is as follows:
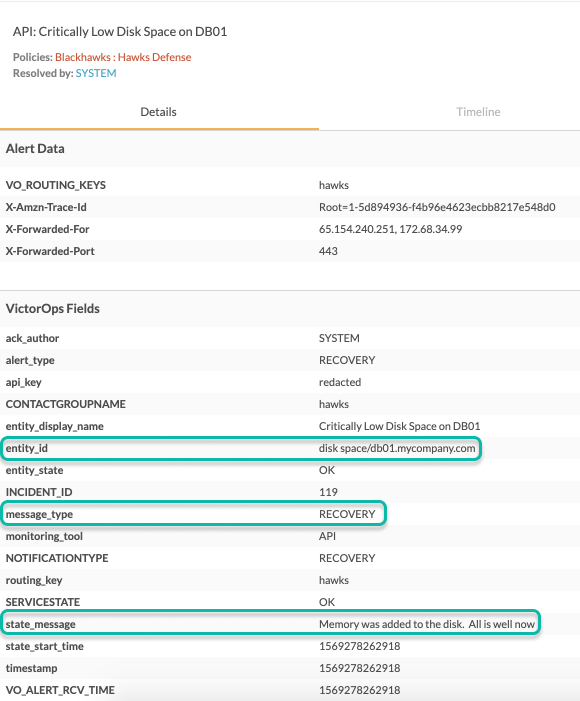
Resolve an incident 🔗
The following request resolves the same incident opened in the previous example. Notice that the entity_id is the same, allowing Splunk On-Call to identify to which incident this request applies:
{ “message_type”:“RECOVERY”, “entity_id”:“disk
space/db01.mycompany.com”, “entity_display_name”:“Critically Low Disk
Space on DB01”, “state_message”:“Memory was added to the disk. All is
well now” }
The response looks like the following:
{ “result” : “success”, “entity_id” : “disk space/db01.mycompany.com” }
The resulting incident in Splunk On-Call is as follows:
cURL and incident response 🔗
You can also call the endpoint using cURL commands. For example:
curl -X POST -d ‘{“entity_id”:“ID of the
incident”,“message_type”:“critical”,“state_message”:“hi, this is some
state message.”}'
https://alert.victorops.com/integrations/generic/20131114/alert/[YOUR_REST_ENDPOINT_KEY]/[ROUTING_KEY_HERE]
Annotations 🔗
By adding an annotation field to the alert payload you can include annotations in an alert sent to Splunk On-Call using the REST endpoint. You can annotate INFO, WARNING, and CRITICAL alerts by adding the annotation field to the JSON payload.
When an incident is in an acknowledged state and a new alert with the same entity_id comes into the Splunk On-Call Timeline, the alert is aggregated under the open incident. See Notification Aggregation. Any new annotations carried in the most recent alert are added to the annotation tab of the incident. The annotations are also reflected within each alert payload.
Annotation payloads 🔗
There are 3 types of annotations accepted by Splunk On-Call through the following syntax. You can customize the title of your annotation at the end of your annotation syntax. For example, in the previous screenshot the title of the URL annotation appears in Splunk On-Call as Runbook.
URL: *vo_annotate.u.url*
{ “monitoring_tool”: “API”, “message_type”:“INFO”,
“entity_id”:“disk.space/db01”, “entity_display_name”:“Approaching Low
Disk Space on DB01”, “state_message”:“The disk is really really full.
Here is a bunch of information about the problem”,
“vo_annotate.u.Runbook”:“https://help.Splunk On-Call.com/knowledge-base/rest-endpoint-integration-guide/”
}
Note: *vo_annotate.s.note*
{ “monitoring_tool”: “API”, “message_type”:“INFO”,
“entity_id”:“disk.space/db01”, “entity_display_name”:“Approaching Low
Disk Space on DB01”, “state_message”:“The disk is really really full.
Here is a bunch of information about the problem”,
“vo_annotate.s.Note”:“Once Disk Space is critically low there will be an
incident!” }
Note
Annotations have a 1,124 character limit.
Image URL: *vo_annotate.i.image*
{ “monitoring_tool”: “API”, “message_type”:“INFO”,
“entity_id”:“disk.space/db01”, “entity_display_name”:“Approaching Low
Disk Space on DB01”, “state_message”:“The disk is really really full.
Here is a bunch of information about the problem”,
“vo_annotate.i.Graph”:“https://community.iotawatt.com/uploads/db6340/original/1X/266a3917cc86317830ae9cda3e91c7689a6c73a7.png”
}