Splunk RUM 組み込みダッシュボード 🔗
内蔵ダッシュボードは、アプリケーションに関するチャート、メトリクス、集計を提供します。
ダッシュボード |
データのタイプ |
|---|---|
モバイルアプリの健全性 |
|
ブラウザアプリの健全性 |
|
ブラウザページの健全性 |
|
内蔵ダッシュボードのユースケース 🔗
以下のユースケースは、架空のeコマース企業であるButtercup Industriesの例を取り上げています。
内蔵ダッシュボードからトラブルシューティングする 🔗
Buttercup Industries のサイト信頼性エンジニアである Kai は、Splunk RUM for Browser を使用してパフォーマンスのボトルネックを特定し、ウェブバイタルを監視することで、Buttercup Industries のウェブサイトで顧客が直面する問題のトラブルシューティングを行っています。Kai は内蔵のダッシュボードを使用して、Buttercup Industries のアプリケーションの健全性を高レベルで評価しています。彼らはデータを掘り下げるために Troubleshoot from this time window から RUM を開きます。例えば、Kai がブラウザの種類別にトラフィックを調査したい場合、Splunk RUM で次のようにデータを調査することができます:

より多くの時間範囲のデータを確認する 🔗
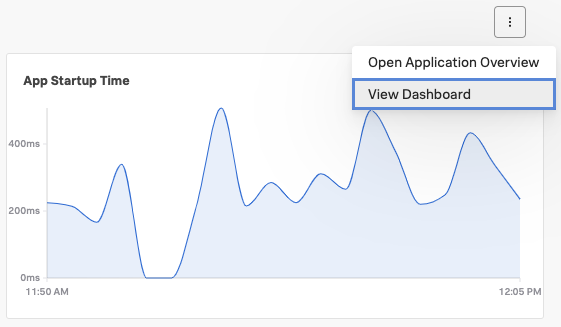
Buttercup Industries のサイト信頼性エンジニアである Kai は、Splunk RUM for Mobile を使用してリリースを監視し、ユーザーから報告された問題の根本原因を突き止め、重要なメトリクスを測定しています。Kai は Application summary dashboard を見て、モバイルパフォーマンスメトリクスの概要を確認しています。Kai が厄介な傾向を発見した場合、組み込みのダッシュボードを開いて、興味のあるデータのより長い期間を見ることができます。RUMからのデータは8日間保持されます。内蔵ダッシュボードからのデータは13か月間保持されます。データ保持の詳細については、Splunk Observability Cloudのデータ保持 を参照してください。

アラートとディテクターのダッシュボード 🔗
RUMアラートとディテクターのチャートとダッシュボードを作成するには、以下を参照してください: