ディテクターのアラートのプレビュー 🔗
適切なアラートを設定することは、通常、試行錯誤のプロセスです。アラートを設定し、それがトリガーされたときに通知を受け(うまく行かなければ、トリガーされるべきときに通知が届かず)、必要に応じてトリガー条件を調整し、次のアラートを待ちます。Splunk Infrastructure Monitoringは、この試行錯誤のプロセスを迅速化するためのアラートプレビュー機能を提供します。(ディテクターの管理にSplunk Observability Cloud APIを使用している場合、この機能は、POST /v2/signalflow/preflight のAPIエンドポイントに対応します。)
アラートプレビューの仕組み 🔗
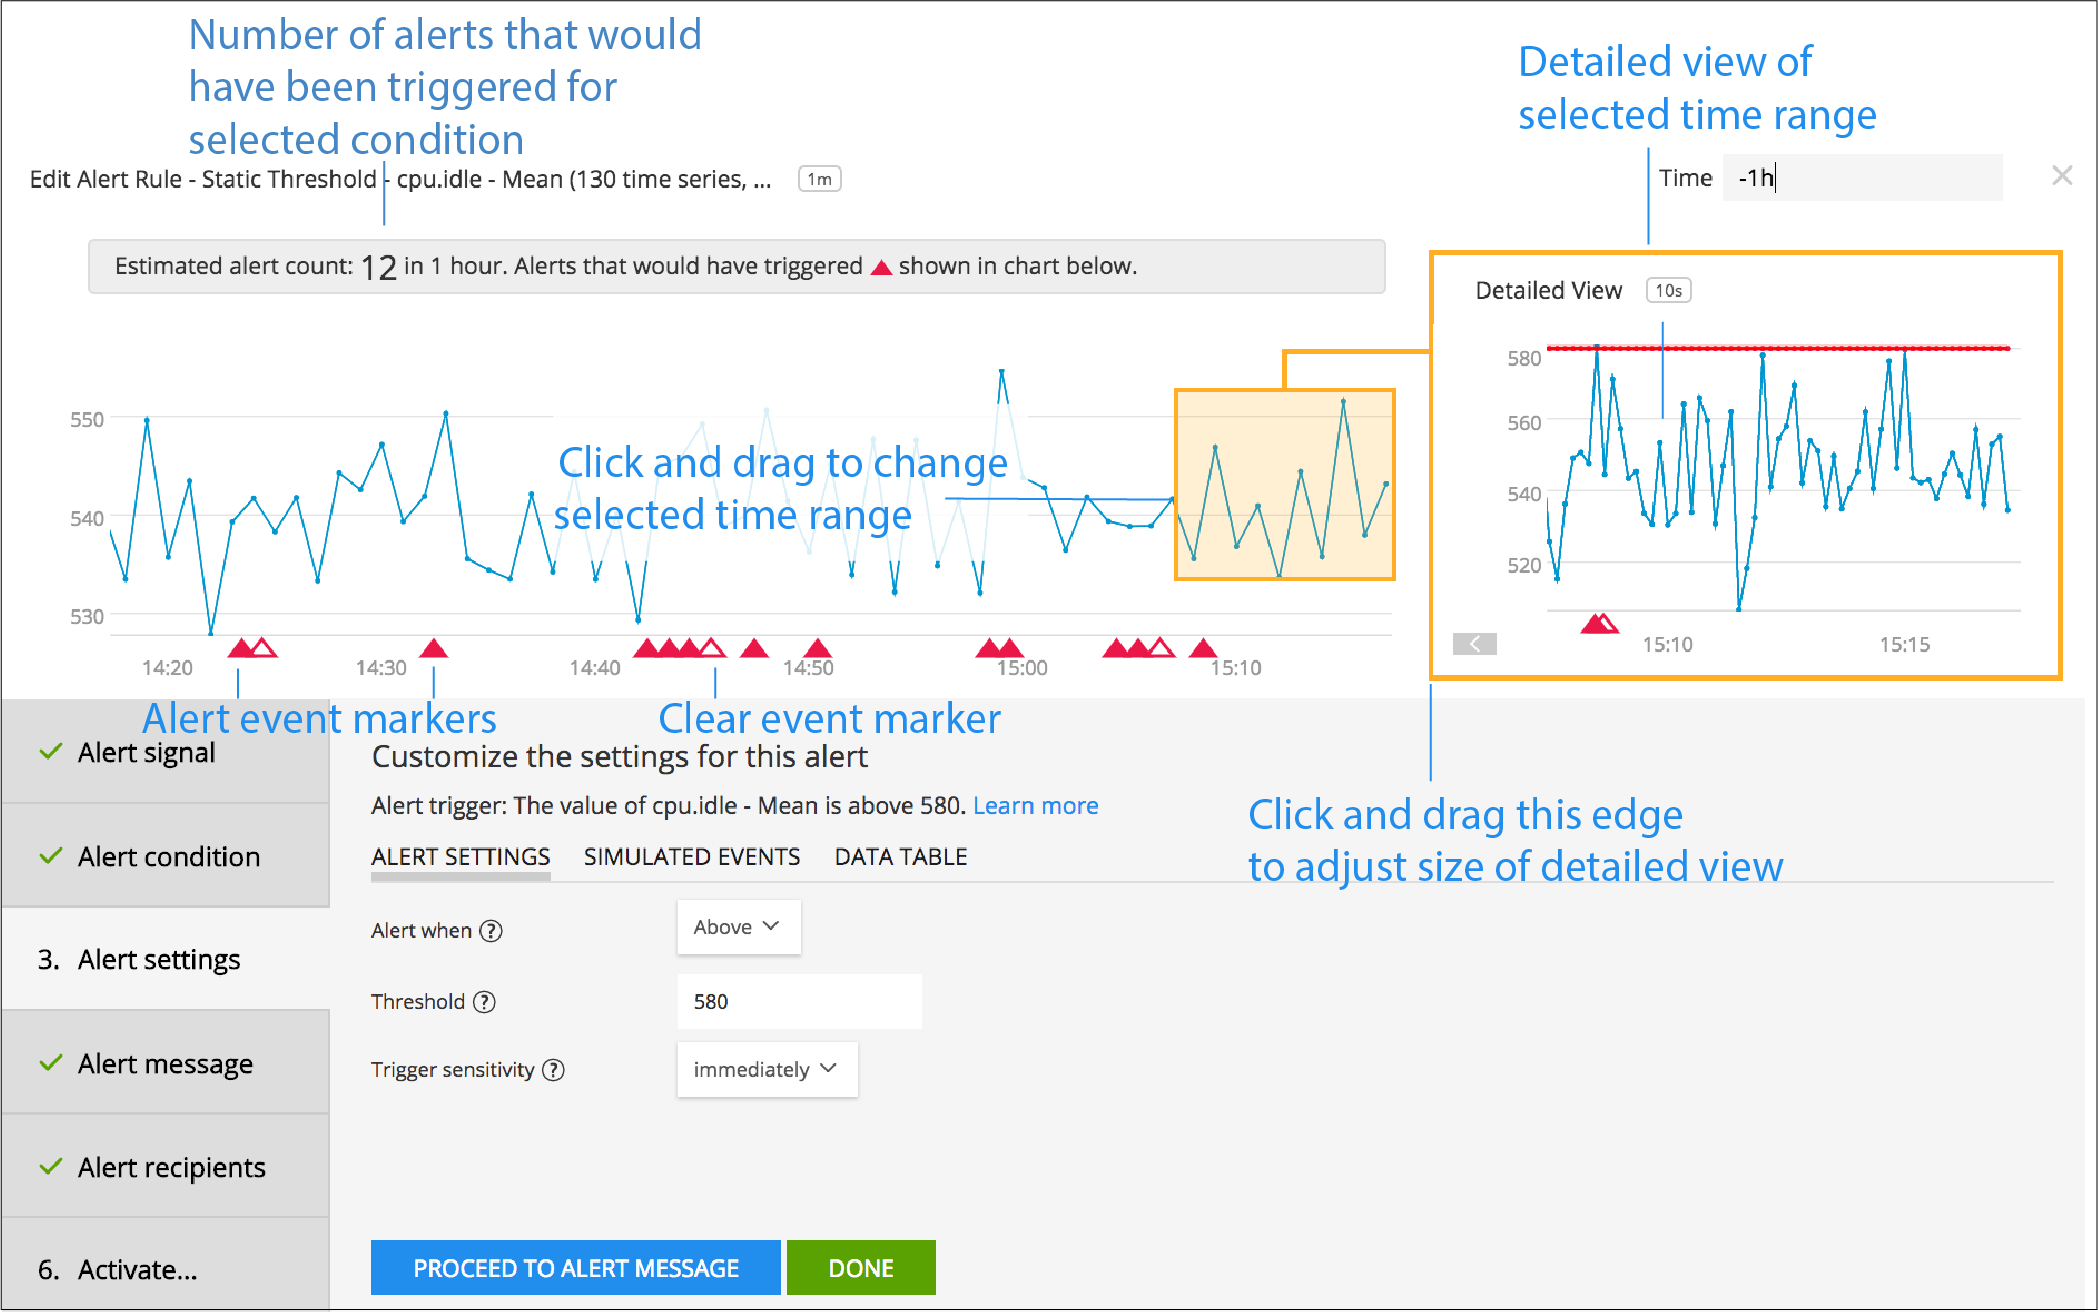
ディテクタールールの作成中または編集中に「アラート設定」タブに移動すると、Splunk Infrastructure Monitoringがデータに対してその設定を実行し、設定内容が要件に対して適切かどうかを判断するのに役立つプレビューチャートを生成します。このプレビューには、ディテクターで指定した時間範囲においてアラートがトリガーされるはずのタイミングが表示されます。このプレビューを使用して、アラートをトリガーするための設定内容の微調整を行い、期待するアラートを期待するタイミングで確実に受信できるようにすることができます。

注釈
APIを使用して作成されたディテクターを編集している場合は、「アラートルール」タブを使用してルールを管理しているときにアラートプレビューを利用できます。プレビューは、SignalFlowテキストを編集しているとき、またはディテクターの時間範囲を変更したときにトリガーされます。
チャートに表示されるデータは、ディテクターの時間範囲に基づいてロールアップされることがあります。詳細ビューでは、チャート上で選択された期間のデータがディテクターの解像度で表示されます。つまり、ディテクターがアラートのトリガーまたは解除を判断するためにシグナルを監視する頻度で、データポイントが表示されます。このビューでは、チャートで選択された期間について、ディテクターが見ているデータそのものを確認できます。詳細ビューの左端を選択してドラッグすると、ビューが拡大され、データがより見やすくなります。
プレビューが表示されている間、タブ間を移動することができます。例えば、「アラートシグナル」タブに移動し、「データテーブル」を見て、アラートのトリガー前、トリガー中、トリガー後のシグナルの値を確認することができます。
注釈
プレビューは、1週間前(-1w)までの期間に対して生成できます。ディテクターの時間範囲が1週間を超える場合(言い換えると、-31dを指定して前月のデータを表示した場合)、プレビューには、直前の1週間の期間のみのアラートマーカーが表示されます。
以下のセクションでは、プレビュー機能を使用してディテクターを要件に合わせて調整する方法の例を示します。
過去のアクティビティに基づいて既存のディテクターを修正する 🔗
すでにシステムでアラートをトリガーしているディテクターがある場合、それらの一部の感度が高すぎる(アラートをトリガーする頻度が高すぎる)か、または十分な感度がない(問題について通知を受けたいときにアラートをトリガーしない)ことに気づくかもしれません。いずれの場合も、プレビューオプションを使用して、適切な数のアラートをトリガーするようにディテクターの設定を変更できます。
ディテクターのプレビューオプションを使用するには、ディテクターを開き、時間範囲を例えば-1wに設定して、過去1週間にトリガーされたすべてのアラートを表示します(対処中の問題をより適切に表すさらに短い時間範囲を設定することもできます)。「アラートルール」タブを表示し、アラート条件を編集し、「アラート設定」タブを開きます。チャートの表示は、実際の過去のアラート(該当するものがある場合)の表示から、アラート条件に基づいてトリガーされたであろうアラートのプレビュー表示に変わります。
アラート条件の種類に応じて、ディテクターの感度を上げるか下げるかのオプションがあります。たとえば、必要以上に多くのマーカーが表示される場合(アラートが flappy すぎる場合)は、トリガー感度を「高」から「中」または「低」に変更したり、感度を「即時トリガー」から「一定時間経過後トリガー」に変更したりできます。多くのアラート条件では、「トリガー感度」に「カスタム」を選択することができ、アラートがトリガーされるタイミングをより詳細に制御することができます。
これらの変更を行うと、プレビューが更新され、新しい設定に基づいてトリガーされるであろうアラート数がチャートに表示されます。期待する動作をより正確に反映するようにディテクターを変更したら、Activate` を選択し、アラートルールを更新します。
注釈
アラート条件を変更してディテクターを保存すると、現在アクティブなアラートのステータスは「停止済み」に設定されます。
最近のアラートに基づいて新しいディテクターを作成する 🔗
過去数時間にシグナルが急上昇し、その急上昇を監視するために 新しいディテクターを作成 するとします。「シグナル」タブで急上昇したシグナルを追加し、「アラート条件」タブで適切な条件を選択します。
注釈
このシグナルをプロットラインとして含むチャートがすでにある場合、ゼロから新しいディテクターを作成する代わりに、チャートからディテクターを作成する ことができます。「アラート条件」タブでルールの作成を開始する際に、そのシグナルを選択します。
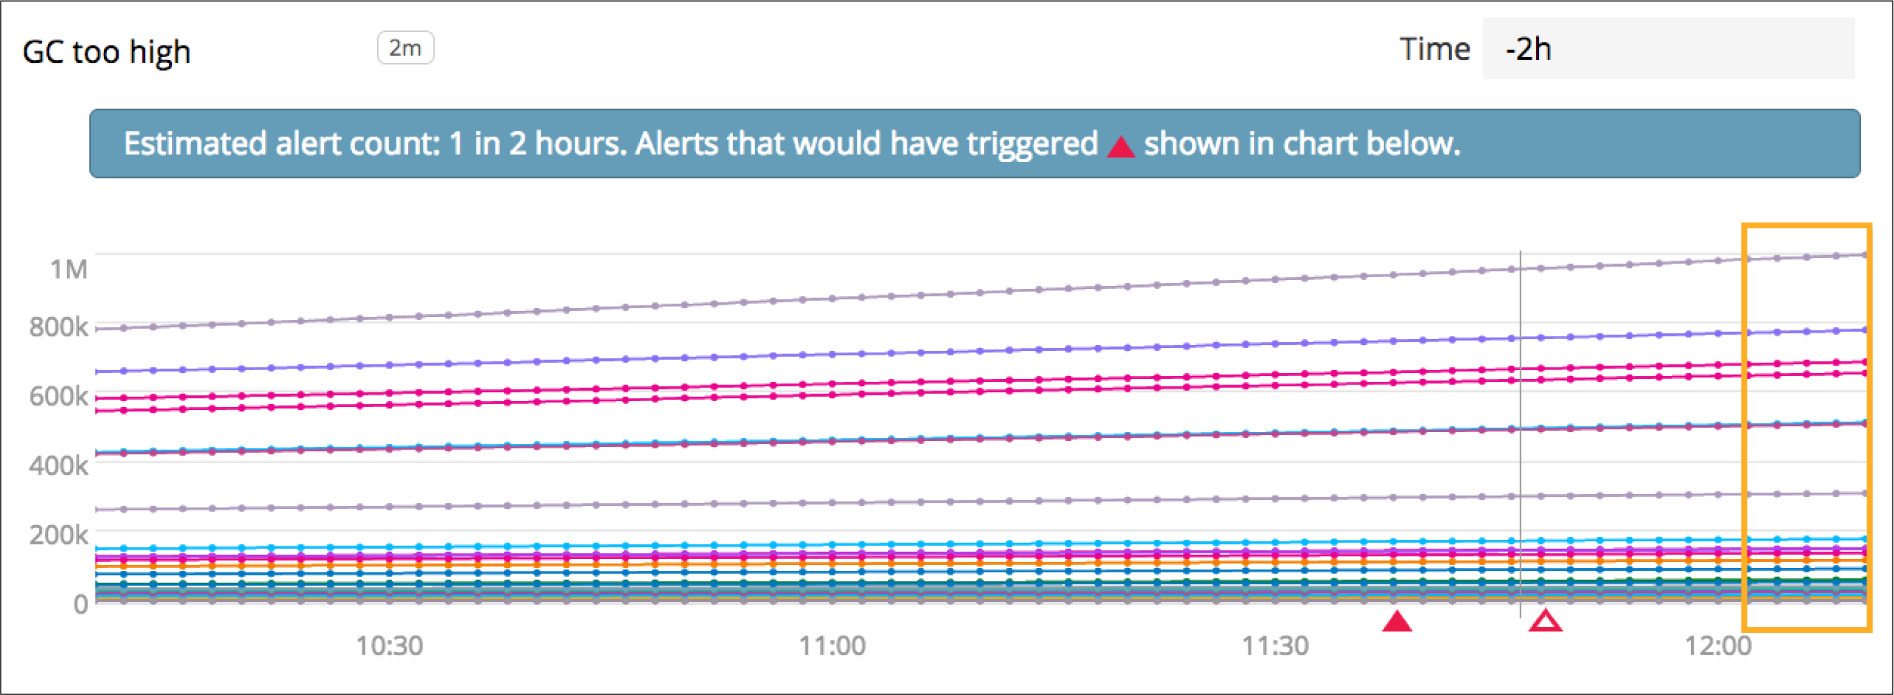
この例では、ディテクターの時間範囲を-2hに設定し、ディテクターと新しいルールに名前を付け、急激な変化 条件を選択しています。これは、最近の値と以前の値を比較する条件です。トリガー感度(デフォルトは「低」)に基づいて、プレビューチャートでは、過去1週間の間にアラートがトリガーされたであろう時間にイベントマーカーが表示されます。急上昇が発生した時間にイベントマーカーが見えているはずです。また、過去1週間でシグナルが急上昇したその他の時間のマーカーや、アラート条件が解除されたことを示すマーカーも表示されるでしょう。

使用するアラート条件の種類によって、感度を調整するオプションが異なります。
最近のシグナル値に基づいて新しいディテクターを作成する 🔗
この例では、静的な閾値を使って条件を設定します。私たちはチャートを確認し、ちょうど良さそうな閾値を選択しました。しかしプレビューを見ると、前日に11個のアラートを受信していたであろうことがわかります。

閾値を上げると、予測されるアラートの数は減ります。

データにふさわしいプレビューが表示されるまで、設定の調整を続けます。静的閾値条件では、閾値を調整することができますが、アラートをトリガーする速さも調整することができます。詳細については、静的閾値 を参照してください。これらの設定を組み合わせて使用し、要件に合わせてディテクターをカスタマイズします。
使用するアラート条件の種類によって、感度を調整するオプションが異なります。