ディテクターを表示する 🔗
ディテクターは、リスト内の行項目として、または個別に表示することができます。個々のディテクターを開くと、そのルールと設定も表示されます。
全ディテクターのリストを見る 🔗
To see a list of existing detectors, open Detectors & SLOs page and select the Detectors tab.
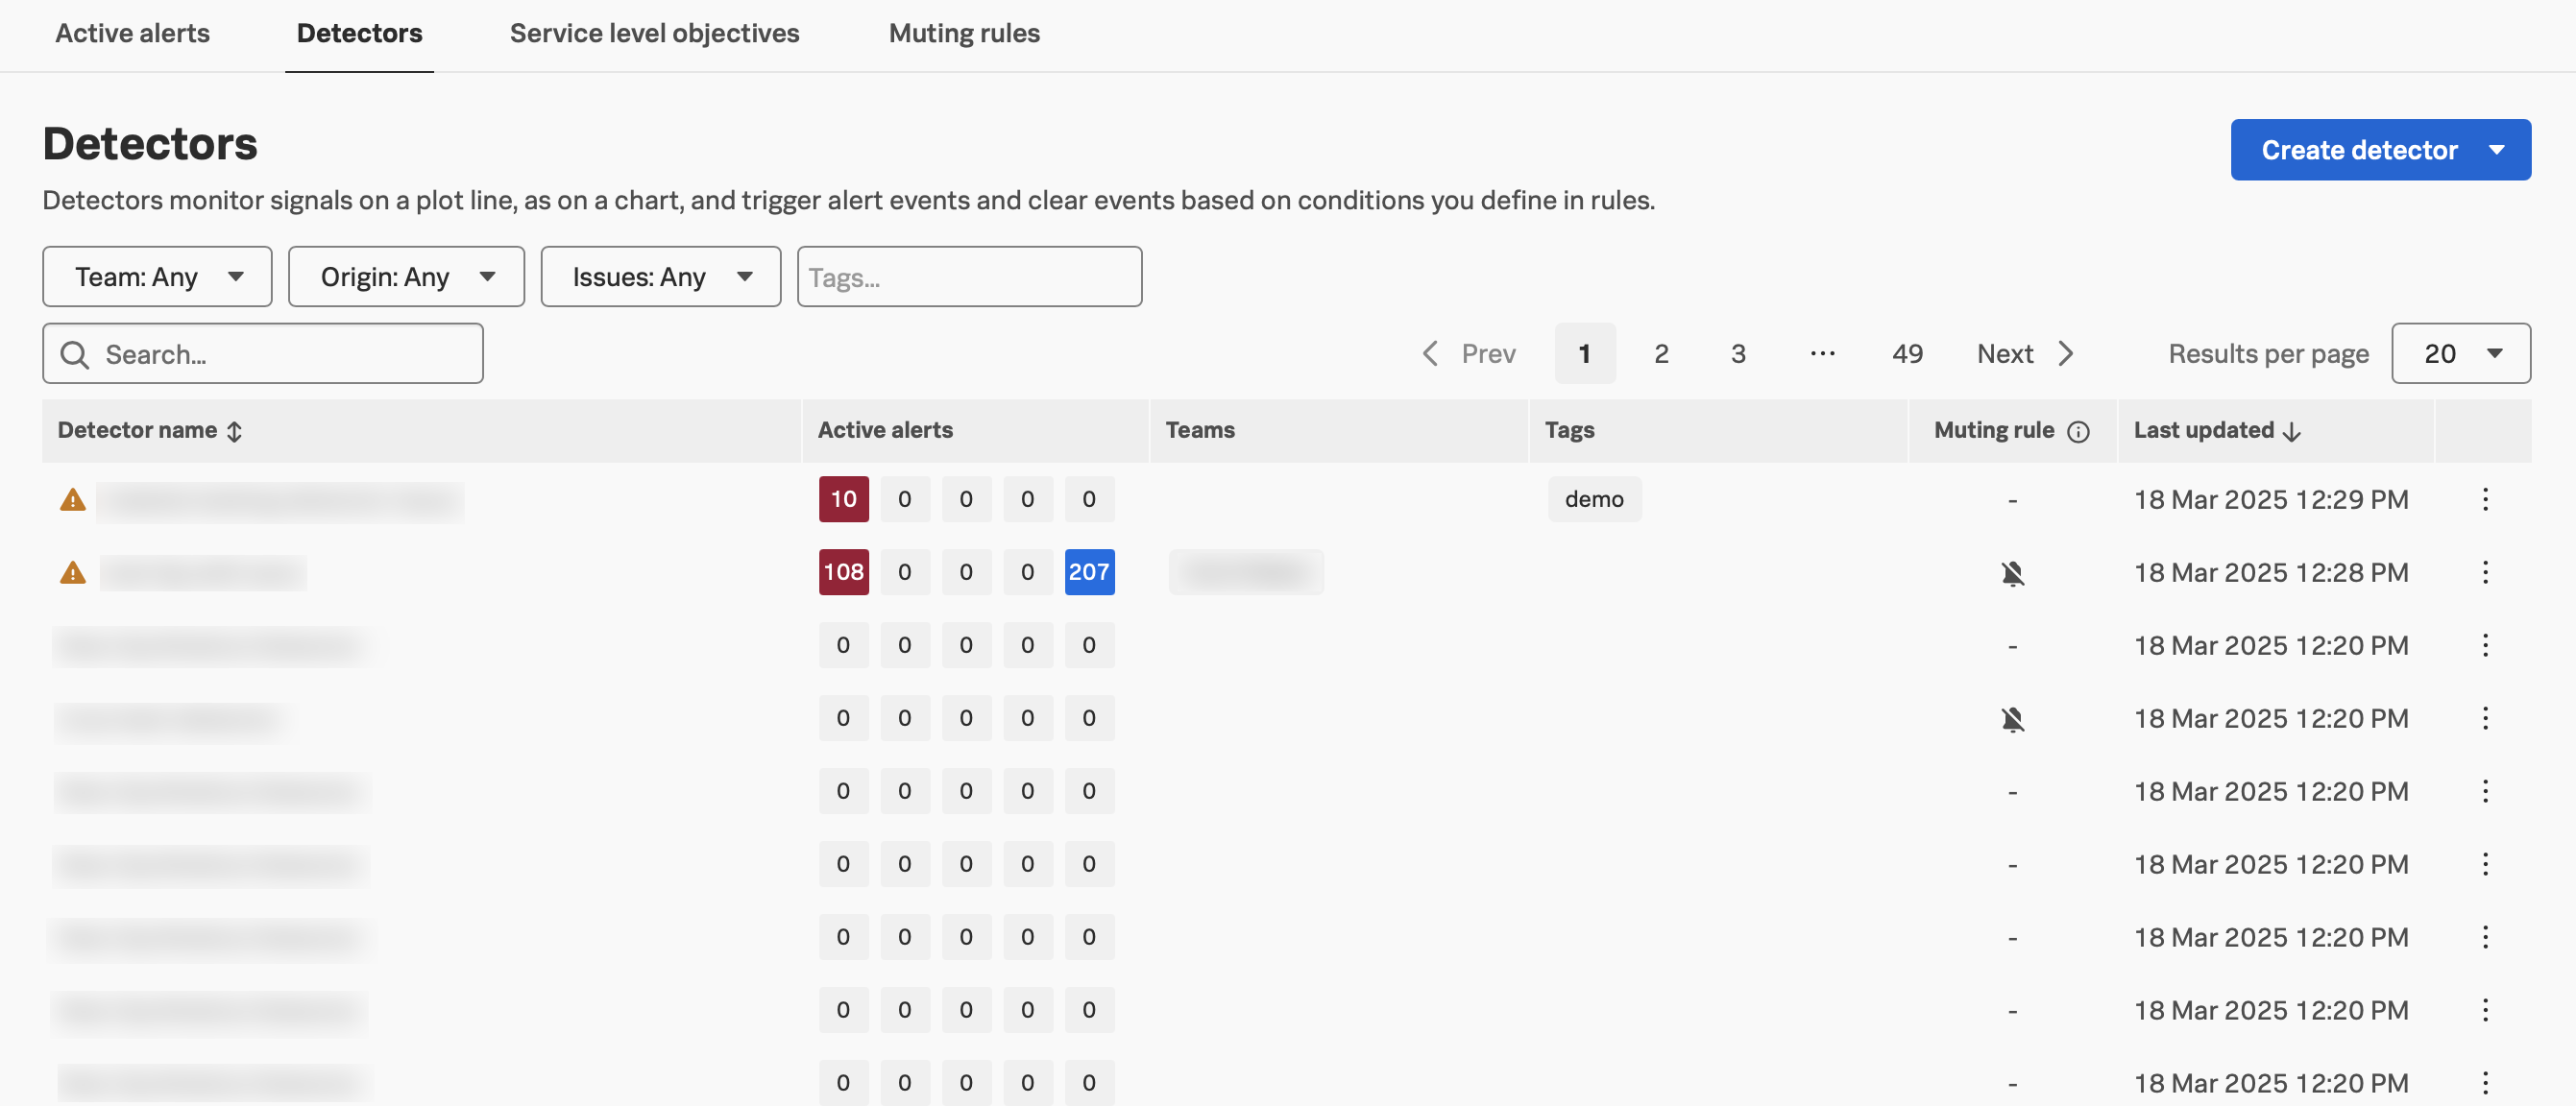
By default, detectors are sorted by last updated, with the most recently updated detector at the top. To reverse the sorting order or sort detectors by a different criterion, select the corresponding column header.
Detectors with issues are indicated by a warning triangle icon. Hover over the icon to see the issue.
Detectors show the number of associated active alerts by severity level under the Active alerts column. Select a number to see all active alerts detail for a certain detector.
Detectors with active or scheduled muting rules directly applied to them have a muting indicator. If a detector is muted but the muting rule applies only to the detector’s properties, the detector doesn’t have a muting indicator.
Filter the detectors list 🔗
To filter detectors by assigned teams, select the Team menu and select or enter the team name you want to find.
To filter detectors by origin, select the Origin menu. You can filter detector by the following origins:
Standard: User-created detectors, including all RUM, APM, Synthetics, and custom detectors.
AutoDetect: Read-only detectors Splunk Observability Cloud automatically creates when you configure supported integrations. To learn more, see AutoDetectアラートおよびディテクターの概要.
Customized AutoDetect: AutoDetect detectors that you copy and customize. To learn more, see AutoDetectディテクターをコピーしてカスタマイズする.
To filter detectors by issues, select the Issues menu. You can filter detectors by the following issues:
Archive metrics: Detectors using archive metrics might misfire alerts or stop alerting.
MTS limit exceeded: Detectors exceeding MTS monitoring limit might not trigger or might trigger incorrectly. To learn more, see ディテクターのdata()関数ごとの許容MTS最大数.
To filter detectors by tags, enter the tags you want to find. Each entry must be an exact match. For example, searching for abc doesn’t return results for abcd.
View detectors linked to a chart 🔗
In dashboards and navigators, you can link detectors and view detectors linked to a chart. Linking detectors helps ensure that everyone in your organization is using the same detectors to monitor the same data.
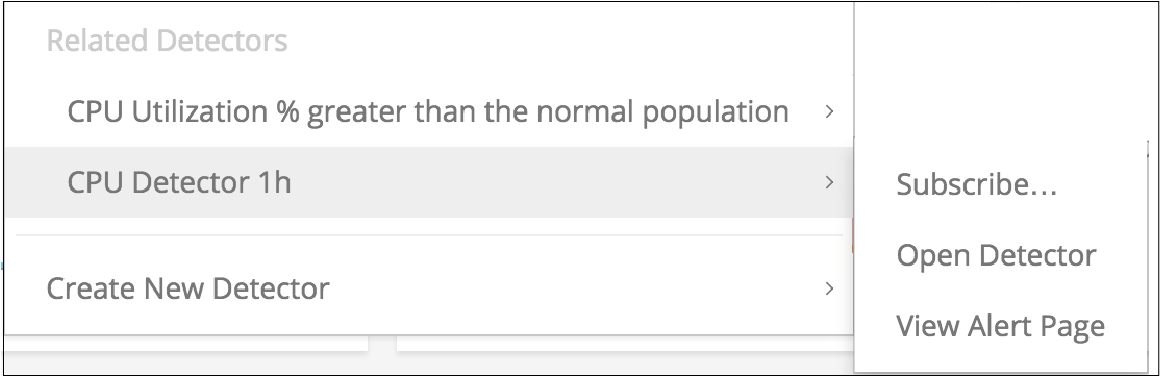
To add or view linked detectors, select the bell icon in a chart.
The following illustration shows two linked detectors for this chart. If you hover over a linked detector, you see options that let you view active alerts, open the detector for viewing and editing, subscribe to the detector by adding a new notification, or edit linked detectors for the chart.
個々のディテクターを見る 🔗
Custom detectors and other standard detectors have different views.
View custom and APM detectors 🔗
When you open a custom or APM detector, you can see a summary chart and a detailed chart. The summary chart shows the data over a longer period of time. Short spikes are not visible in the summary chart. The detailed chart shows each data point at the native resolution of the detector and represents exactly the data points that the detector sees. The yellow box controls which part of the summary chart displays in the detail chart. You can see a short-term spike in the detail view by dragging the yellow box to the area where the alert fired.
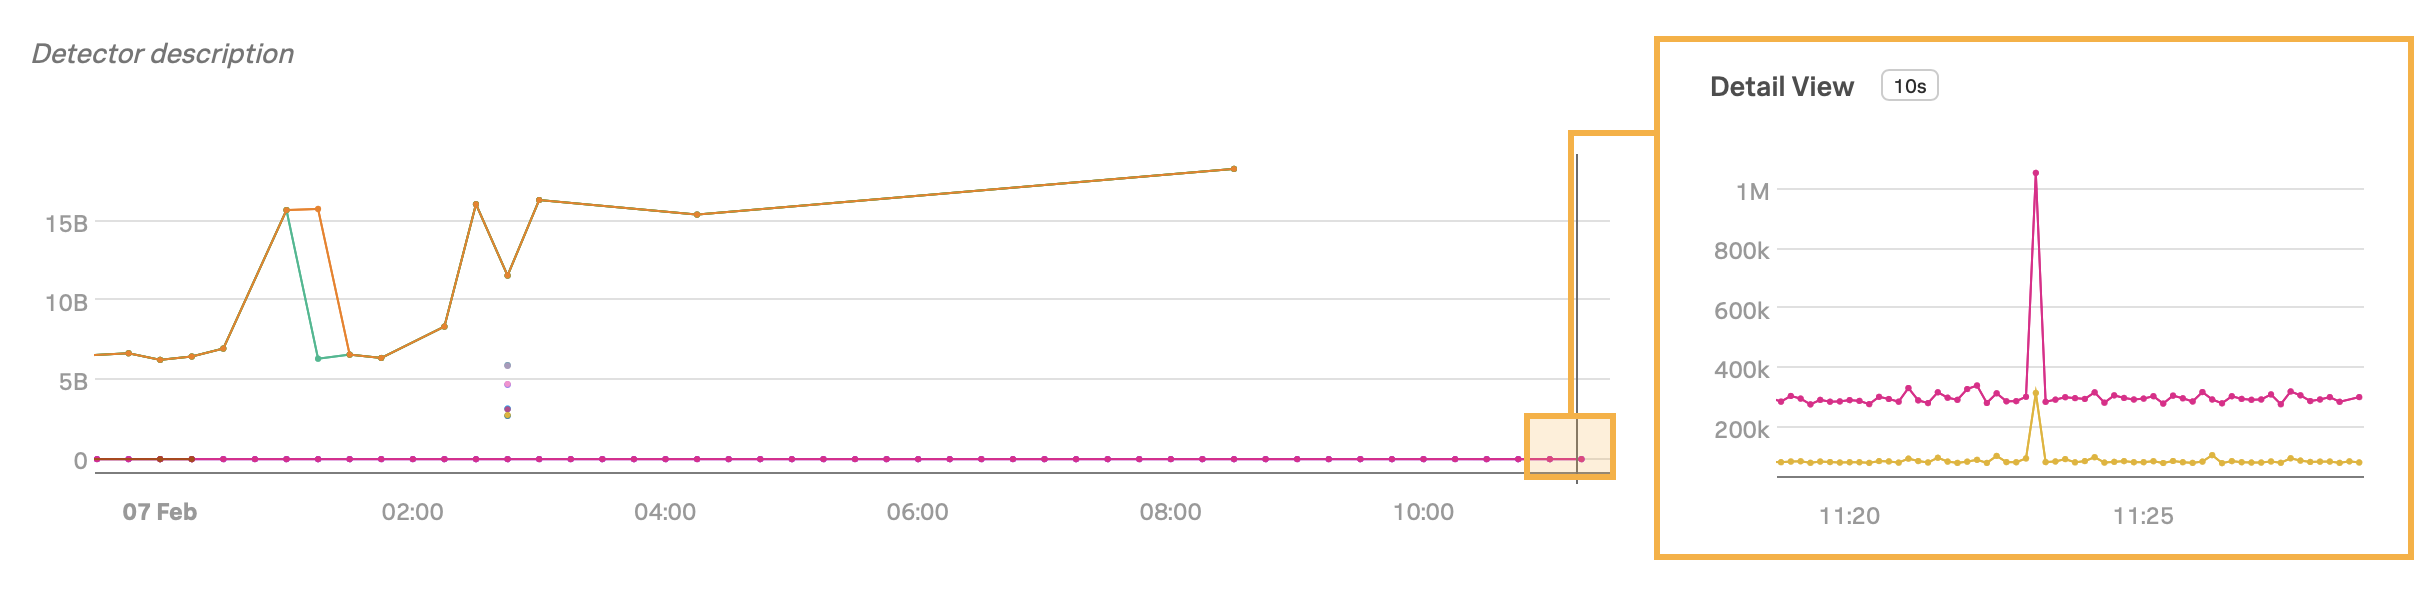
The resolution of data displayed is determined by the detector’s time range. The detail view displays data at the detector’s resolution, the frequency at which the detector evaluates the signal. Any events occurring during the detector’s time range are shown under the X axis.
The Alert Rules tab is open when you open a detector, showing a chart that represents values for the visible signals. The list of detector rules and the number of currently active alerts for each rule are visible. To learn more, see ディテクターに対してアクティブなアラートを確認する. For information on creating rules, see ディテクターのアラートルールを作成する or Splunk APMでディテクターとアラートを設定する, depending on the type of detector.
注釈
If a detector contains a SignalFlow tab, you are viewing a detector that created using the API.
このAPIに精通している場合は、このタブを使用してディテクターコードを表示および編集したり、ディテクタールールを変更したりすることができます。詳細については、SignalFlowタブでディテクターを編集する を参照してください。
View RUM and Synthetics detectors 🔗
When you open a RUM or Synthetics detector, you can see alert configurations and a summary chart for the detector’s data.
To learn more about RUM detectors, see Splunk RUM データに対するアラート.
To learn more about Synthetics detectors, see ディテクターとアラート.
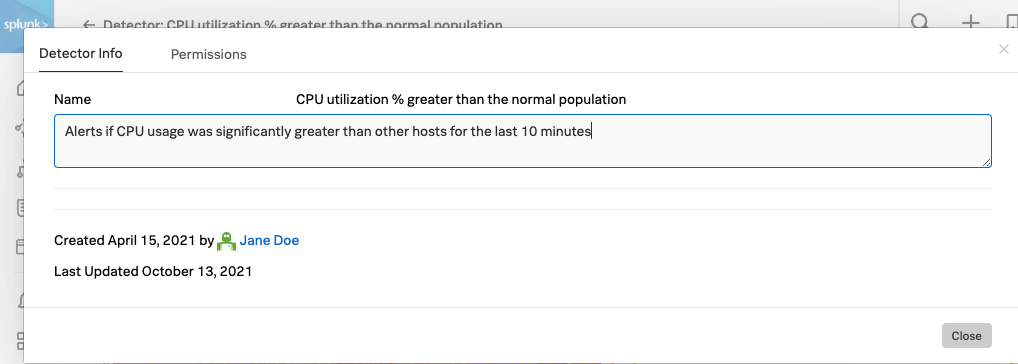
ディテクターのプロパティを見る 🔗
To see a detector’s properties, such as its description and creator, follow these steps:
ディテクターを開きます。
Select the detector’s actions menu (⋯), then select Info.