ブラウザテストをセットアップする 🔗
ブラウザテストを使用して、提供するURLの合成テストを実行することにより、単一ページまたは複数ステップのユーザーフローのユーザーエクスペリエンスをモニターします。このタイプのテストは、コンバージョン経路、または複数のステップを必要とする経路、あるいはJavaScriptを実行する経路を監視するために使用します。例については、シナリオ:ブラウザテストを使用するマルチステップワークフローを監視する を参照してください。
ブラウザテストでチェックされた各ページについて、Splunk Synthetic MonitoringはHTTP Archive (HAR) ファイルをキャプチャし、ウォーターフォールチャートで表します。ブラウザテストでは、40以上のメトリクスも取得できます。詳しくは ウォーターフォールチャート と ブラウザテストメトリクス を参照してください。
注釈
監視対象のサイトやアプリケーションが、訪問者の許可リストやブロックリスト、またはトラフィックを測定するための分析ツールを使用している場合は、Splunk Synthetic Monitoring からのトラフィックに対応するように設定されていることを確認してください。手順については 合成テストを実行できるようにサイトを準備する を参照してください。
ブラウザテストをセットアップする 🔗
最適な体験のために、ブラウザテストでは、Google Chromeの安定版( 116.0.5845.96-1 )を使用して、ユーザーのアクティビティをシミュレートしています。
以下の手順に従って、ブラウザテストをセットアップしてください:
Splunk Observability Cloud のランディングページから、Splunk Synthetic Monitoring に移動します。
Tests で Create new test を選択し、ドロップダウンリストから Browser test を選択します。テスト作成ビューが開きます。
Name フィールドに、テストの名前を入力します。
ブラウザテストにステップと合成トランザクションを追加するには、Edit steps or synthetic transactions を選択します。詳しくは、ブラウザテストに合成トランザクションを追加する を参照してください。
テストを構築するときに、Try now を使用して、テストの構成が有効であることを確認できます。Try nowの結果は一時的であり、永続化されたrunメトリクスには影響しません。try nowでテスト設定を検証する を参照してください。
(オプション) ステップが実行されるまでの待ち時間を追加します。待ち時間 を参照してください。
(オプション)テストが最初に失敗した場合に自動テスト再試行を有効にします。
テストを保存します。
テストの詳細をカスタマイズする 🔗
以下の手順を使用して、テスト設定をカスタマイズし、テストの作成を完了します:
Locations フィールドに、URLをテストする場所を入力します。1つまたは複数の場所を選択できます。
Device Type フィールドで、テストを実施するデバイスをリストから選択します。
Frequency フィールドで、希望するテスト頻度をリストから選択します。
(オプション) Round Robin セレクターを使用して、オプションを切り替えます。ラウンドロビンを有効にすると、選択した場所を1つずつテストが循環します。ラウンドロビン実行を無効にすると、選択した頻度で選択したすべての場所から同時にテストが実行されます。
このテストからアラートを受信したい場合は、+ Create detector を選択して、テストにディテクターを設定します。ダイアログボックスを使用してディテクターをカスタマイズします。
Submit を選択します。すると、新しいテストの「テスト履歴」ページにリダイレクトされます。このテストを作成したばかりの場合は、テストが合成データの収集を開始するまで、少なくとも1回のテスト頻度間隔を空けてください。
(オプション) Edit test またはテストの行にある3つのドットの Actions メニューを選択し、このテストの編集、一時停止、複製、削除を行います。
こちらも参照してください 🔗
テストを実行できる場所については、パブリックロケーション を参照してください。
ディテクターのオプションについては、ディテクターとアラート を参照してください。
Google Chrome Recorderから生成されたJSONファイルをインポートする 🔗
テスト作成プロセスを簡素化するために、Google Chrome Recorder を使用して記録を作成します。その後、JSON ファイルを Splunk Synthetic Monitoring にインポートすると、追跡したい個々のインタラクションを追加する代わりに、ワークフローのステップを自動的にインポートできます。記録は、複雑なユーザーフローや、ステップ数が多いテストに特に役立ちます。
Google ChromeレコーダーJSONファイルを作成する 🔗
Google Chrome の記録の作成手順については、Google ドキュメントの Chrome Developer ユーザーガイド の 「ユーザーフローの記録、再生、測定」 を参照してください。
要件
Google Chrome Recorderで、記録するセレクターのタイプにCSSまたはXPATHを選択します。
ブラウザテストは1つのブラウザタブのみで実行されます。複数のタブにまたがって記録することはできません。
Google Chrome RecorderのJSONファイルをインポートする 🔗
注釈
Google Chrome Recorderからの録画には、録画で使用されたブラウザウィンドウの特定のビューポートサイズが含まれています。記録をインポートする際、Splunk RUMはビューポートサイズをブラウザテストにインポートしません。そのため、テストのデバイス設定が、記録されたブラウザウィンドウで使用されているビューポートサイズと一致していることを確認する必要があります。
Google Chrome Recorderから新規または既存のブラウザ テストにJSONファイルをインポートするには、以下の手順に従ってください。
Splunk Synthetic Monitoring で、既存のブラウザ テストで Edit を選択してテスト設定ページを開くか、新しいテストを作成します。
Import を選択します。
Google Chrome RecorderのJSONファイルをアップロードします。
ステップがサポートされていない場合は、テスト設定ページでそのステップを編集または削除してください。
(オプション)各ステップに名前を付けます。
変更を保存します。
サポートされていないステップをトラブルシューティングする 🔗
録画に未対応のステップが含まれている場合は、そのステップを編集して、サポートされているブラウザのステップタイプのいずれかにフォーマットし直す必要があります。次の表は、Google Chrome Recorderのステップ名とコードスニペットが、ブラウザテストでどのように対応するかを示しています。これらの例では、Buttercup Games(架空のゲーム会社)を使用しています。
{
 // Google Chrome Recorder
  "type": "navigate",
  "url": "www.buttercupgames.com",
  "assertedEvents": [
     {
        "type": "navigation",
        "url": "www.buttercupgames.com",
        "title": "Buttercup Games"
     }
  ]
  }
{
// Splunk Synthetic Monitoring code snippet
"name": "Go to URL",
"type": "go_to_url",
"url": "www.buttercupgames.com",
"wait_for_nav": true
}
{
// Google Chrome Recorder
   "type": "click",
   "target": "main",
   "selectors": [
      [
         "div:nth-of-type(2) > div:nth-of-type(2) a > div"
      ],
      [
         "xpath//html/body/main/div/div/div[2]/div[2]/div/a/div"
      ]
   ],
   "offsetY": 211,
   "offsetX": 164,
   "assertedEvents": [
      {
         "type": "navigation",
         "url": "www.buttercupgames.com/product/example",
         "title": "Buttercup Games"
      }
   ]
}
{
 // Splunk Synthetic Monitoring code snippet

    "name": "",
    "type": "click_element",
    "selector_type": "css",
    "selector": "div:nth-of-type(2) > div:nth-of-type(2) a > div",
    "wait_for_nav": true
 }
{
 // Google Chrome Recorder
 "type": "click",
  "target": "main",
  "selectors": [
     [
        "div:nth-of-type(2) > div:nth-of-type(2) a > div"
     ],
     [
        "xpath//html/body/main/div/div/div[2]/div[2]/div/a/div"
     ]
  ],
  "offsetY": 211,
  "offsetX": 164,
  "assertedEvents": []

  }
{
// Splunk Synthetic Monitoring code snippet

   "name": "",
   "type": "click_element",
   "selector_type": "css",
   "selector": "div:nth-of-type(2) > div:nth-of-type(2) a > div",
   "wait_for_nav": false
}
{
 // Google Chrome Recorder
     "type": "change",
     "value": "5",
     "selectors": [
        [
           "#quantity"
        ],
        [
           "xpath///*[@id=\"quantity\"]"
        ]
     ],
     "target": "main"
     }
{
// Splunk Synthetic Monitoring code snippet
      "name": "",
      "type": "enter_value",
      "selector_type": "id",
      "selector": "quantity",
      "option_selector_type": "index",
      "option_selector": "5",
      "wait_for_nav": false
      }
{
// Google Chrome Recorder
      "type": "waitForElement",
      "selectors": [
         [
            "body",
            "#homepage_example",
            ".css-4t2fjl",
            ".eanm77i0"
         ]
      ]
      }
{
// Splunk Synthetic Monitoring code snippet
      "name": "",
      "type": "assert_element_present",
      "wait_for_nav": false,
      "selector_type": "css",
      "selector": "body,#homepage_example, .css-4t2fjl, .eanm77i0"
   }
{
// Google Chrome Recorder
   "type": "waitForElement",
   "selectors": [
      [
         "body",
         "#homepage_product_brand-example",
         ".css-4t2fjl",
         ".eanm77i0"
      ]
   ],
   "visible": false
}
{
// Splunk Synthetic Monitoring code snippet
      "name": "",
      "type": "assert_element_not_present",
      "wait_for_nav": false,
      "selector_type": "css",
      "selector": "body,#homepage_product_brand-example"
      }
{
// Google Chrome Recorder
   "type": "customStep",
   "timeout": 5000,
   "target": "main",
   "name": "customParam",
   "parameters": {}
}
{
// Splunk Synthetic Monitoring code snippet
   "name": "Unsupported step customStep",
   "type": "run_javascript",
   "value": "",
   "wait_for_nav": false
}
ブラウザテストを表示する 🔗
テストを作成して保存したら、期待通りにデータが収集されているかどうかをチェックします:
Tests リストから、3つのドットの Actions メニューを選択し、Play 矢印のアイコンを選択して、手動でテストのライブ実行を開始するか、またはテストが実行されデータが収集される時間があるように、設定したテスト頻度の少なくとも1つの継続時間を待ちます。
関心のあるテストを選択すると、Test history のビューが表示され、最近のテスト結果とメトリクスの視覚化を見ることができます。
ブラウザのテスト結果については、ブラウザテスト結果を解釈する を参照してください。
ブラウザテストを編集する 🔗
ブラウザテストを編集するには、以下のようにします:
Tests リストで編集したいテストの行を選択し、Test history ビューを開きます。
Edit test を選択し、テスト設定を編集します。
テスト名や合成トランザクション名を変更した場合、更新された名前がチャートとディテクターに表示されるまでに最大20分かかることがあります。
ブラウザテストの詳細設定 🔗
合成テストに高度な設定をしたくなる理由はたくさんあります。ここではそのいくつかを紹介します:
ランダムに表示され、テストの流れを中断するモーダルでサイトにアクセスする。たとえば、マーケティング モーダルで、ユーザーにポイント プログラムへの登録を促す場合があります。この問題を回避するには、Cookie を設定して、ポップアップ モーダルが表示されず、テストが妨害されないようにします。
ユーザーがサイトにアクセスするためにログインする必要があるサイトでテストを実行します。
リクエストに
User-Agentヘッダーを設定することにより、テストを実行するデバイスのタイプを指定します。CDNのテスト。例えば、ブラウザでHTMLページをロードしたいが、一部またはすべてのリクエストのホストを新しいホストに書き換えたい場合があります。
リクエストに特定のヘッダーを送信することで、バックエンドの分析からのリクエストをフィルタリングします。
自己署名証明書を持つ本番前のサイトでテストを実行します。
インタラクティブメトリクスの収集 🔗
インタラクティブメトリクスは、テストフロー内の各ページに対してデフォルトで収集されますが、ページが 完全にインタラクティブになるまでの時間によっては、実行時間が長くなることがあります。詳細設定でインタラクティブメトリクスをオフにすると、実行時間が短縮され、結果が早く表示されます。インタラクティブメトリクスをオフにした場合、次のメトリクスがテストから失われる可能性があります:
最初のCPUアイドル:ページが最低限インタラクティブになり、ユーザー入力に反応するまでの時間。
インタラクティブまでの時間:ページがユーザーの入力に素早く反応するまでの時間を測定します。ページのロードが完了したように見えるだけでなく、ページが実際に使用できるようになるタイミングを特定するために使用されます。
Lighthouseスコア:Lighthouseデスクトップスコアリングアルゴリズムのv10を使用して計算された、複数のブラウザテストメトリクス値の加重集約。Lighthouseスコアリングの詳細については、Google開発者向けドキュメントの https://developer.chrome.com/docs/lighthouse/performance/performance-scoring#lighthouse_10 を参照してください。
自動再試行 🔗
テストが失敗した場合、ユーザーの介入なしに自動的に再実行します。ネットワークの問題、タイムアウト、サイトの断続的な問題など、一時的な中断による不要な失敗を減らすために、自動再試行をオンにするのがベストプラクティスです。自動リトライの実行はサブスクリプションの使用量には影響せず、完了した実行結果のみがサブスクリプションの使用量にカウントされます。自動リトライには、少なくともランナーバージョン0.9.29が必要です。
TLS/SSL検証 🔗
この機能を有効にすると、TLS/SSL証明書において、期限切れ、無効なホスト名、または信頼できない発行者の検証を強制するために使用されます。
注釈
自己署名証明書や無効な証明書がある本番前の環境をテストする場合は、TLS/SSL検証機能を無効にしておくのが最善です。
認証 🔗
追加のセキュリティプロトコルを必要とするサイト(企業ネットワーク内など)で認証するための資格情報を追加します。認証を使用するには、ユーザー名とパスワードを入力する必要があります。ユーザー名はプレーンテキストで入力することも、グローバル変数で定義することもできますが、パスワードはグローバル変数を使用して定義する必要があります。パスワードに隠されたグローバル変数を使用して、資格情報にセキュリティの追加レイヤーを作成することが推奨されます。詳細は、グローバル変数を隠すとどうなりますか? を参照してください。
ブラウザテストを実行する際、Chromeブラウザはテスト設定で定義された認証情報で設定されます。認証はOSレベルでは統合されず、ランナー自体では認証処理は行われません。認証情報はChromeに直接渡され、処理されます。
現時点では、Chromeは以下の認証プロトコルをサポートしています:
基本認証
NTLM
Kerberos(制限事項あり)
ダイジェスト
ChromeがKerberos認証をサポートするのは、標準的な規約に基づいて正しいKerberosサービスプリンシパル名(SPN)を推測できる場合のみです。このサポートには Kerberos Credentials Delegation (Forwardable Tickets) は含まれません。
カスタムヘッダー 🔗
各リクエストで送信するカスタムヘッダーを指定します。例えば、リクエストにヘッダーを追加して、バックエンドのアナリティクスからのデータをフィルタリングすることができます。カスタムヘッダーを追加するには、名前と値が必要です。オプションで、ヘッダーをスコープするドメインを指定することもできます。ドメインが指定された場合は、そのドメインに送られたリクエストのみがヘッダーを含みます。そうでなければ、ヘッダーはすべてのドメインへのリクエストに含まれます。
ヘッダーを使用してユーザーエージェントを変更することもできます。デフォルトのユーザーエージェントは、選択したデバイスに対して指定されたエージェントであり、合成ランナーの Chrome バージョンが変更されるたびに更新されます。すべてのドメインのユーザーエージェントヘッダーをカスタマイズするには、ユーザーエージェントフィールドの横にある「デバイスのデフォルトを使用」トグルをオフにしてから、新しい値を入力します。特定のドメインのユーザーエージェントを変更するには、カスタムヘッダーを追加し、そのユーザーエージェントを適用するドメインを指定します。ドメインが指定されていない場合は、最上位のユーザーエージェント設定が優先されます。
カスタムヘッダーを使用してクッキーを設定することもできますが、代わりに以下のセクションで説明されているクッキー設定を使用することをお勧めします。
ホストオーバーライド 🔗
ホストオーバーライドルールを追加して、リクエストをあるホストから別のホストに再ルーティングします。たとえば、開発サイトまたは特定のCDNエッジノードからロードされたページリソースに対して、既存の本番サイトをテストするホストオーバーライドを作成できます。
また、Keep host headers を有効にして、オリジナルの HOST ヘッダーを保持するかどうかを指定することもできます。有効にした場合、オリジナルのリクエストのヘッダーはそのまま残ります(推奨)。無効にされた場合、新しいホストへの HOST ヘッダーの変更が起こるかも しれず、内部的なダイレクト(307)につながる可能性があります。Keep host headers はデフォルトで有効になっています。
注釈
ホストのオーバーライドは、指定した正確なホスト名にのみ適用されます。サブドメインには自動的に適用されません。つまり、ホストオーバーライドはワイルドカードをサポートしていません。サブドメインをオーバーライドする必要がある場合は、サブドメインの完全修飾ドメイン名(FQDN)ごとに個別のホストオーバーライドを作成する必要があります。たとえば、domainA.com のホストオーバーライドを domainB.com に作成した場合、domainA.com へのリクエストは domainB.com にリダイレクトされますが、mail.domainA.com へのリクエストは自動的に mail.domainB.com にはリダイレクトされません。mail.domainA.com のホストオーバーライドを明示的に作成する必要があります。
待ち時間 🔗
カスタム待ち時間を追加してテストカバレッジを最適化し、より長いページロードをキャプチャして、実行結果の精度を向上させます。ロード時間の長いアプリケーションは、ブラウザテストを失敗させる可能性があります。ワークフローに10秒以上かかる特定のステップがあることがわかっている場合は、ブラウザテストにカスタム待ち時間を追加します。
待ち時間はブラウザテストでのみ使用できます。
各テストの最大カスタム待ち時間は200秒です。
以下の手順に従って、ブラウザテストのカスタム待機時間を設定してください:
Splunk Synthetic Monitoringで、ブラウザテストで Edit を選択し、設定パネルを開きます。
ステップタイプのドロップダウンから、New step > Wait を選択します。
名前と待ち時間(ミリ秒)を追加します。
テストのインストルメンテーションが終了したら、ワークフローを保存します: Return to test > Save。
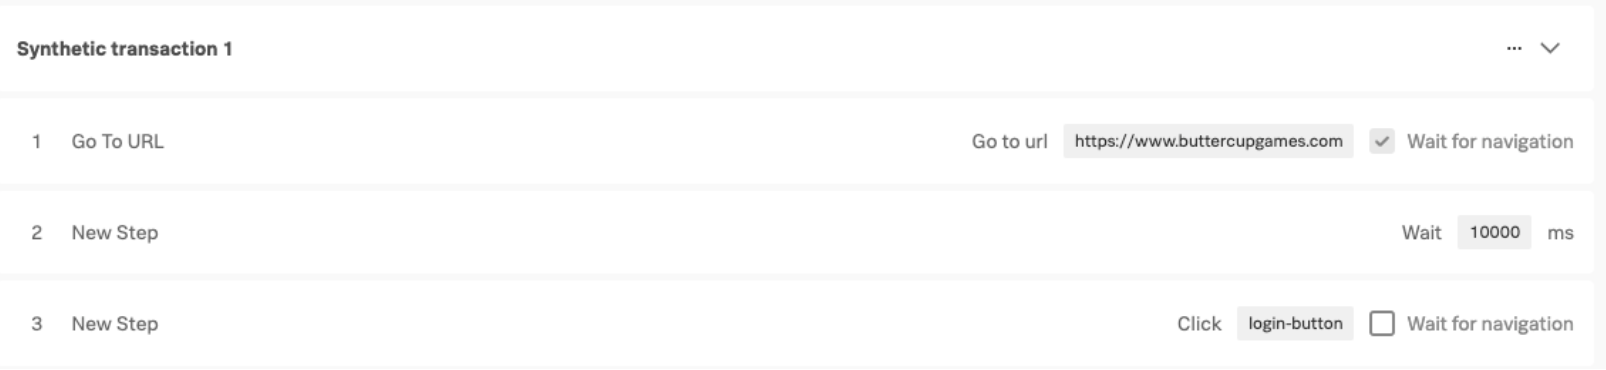
次の画像は、あるURLにアクセスし、10秒間待ってからログインするようにテストを設定する方法を示しています。
設定可能な待ち時間の制限とデフォルト 🔗
各タイプの待機時間の制限を以下に示します。runの上限は30分で、それを過ぎるとタイムアウトとなります。
説明 |
Limit |
|---|---|
アサートステップ |
90秒 |
ナビゲーションの待機 |
20秒 |
説明 |
デフォルト |
|---|---|
アサートの待ち時間 |
10秒 |
ナビゲーションの待機 |
2秒 |
Chromeフラグ 🔗
Google Chrome のフラグはトラブルシューティングに役立つツールです。デフォルトでは利用できないブラウザの機能を有効にして、カスタムブラウザの設定やプロキシサーバーのような特殊なユースケースをテストします。
詳しくは、Google Chrome Developer Guide の Chrome フラグとは? を参照してください。
注意:グローバル変数は Chromeフラグと互換性がありません。
これらは利用可能なフラッグです:
Chromeフラグ |
説明 |
|---|---|
|
リクエストは |
|
QUICを無効にします。これによりHTTP3も無効になります。 |
|
同一オリジンポリシーの強制を無効にします。 |
|
指定された安全でないオリジンを安全なものとして扱います。複数のオリジンは、カンマ区切りのリストで指定することができます。 |
|
与えられたセミコロン区切りのホストリストの任意の指定プロキシのプロキシバイパスリスト。このフラグは |
|
指定したプロキシサーバーを使用してデフォルト設定を上書きします。 |
|
プロキシサーバーを使用せず、常に直接接続を行います。このフラグは、プライベートロケーションに設定した他のプロキシサーバーフラグを上書きするために使用できます。 |
除外ファイル 🔗
特定のファイルタイプやパターンを無視するようにブラウザテストを設定することで、それらのファイルタイプやパターンに一致するHTTPリクエストをすべてスキップすることができます。
除外ルールは次のような場合に有用です:
テスト分析からの誤ったアラートを防ぎます。
特定のリソースのロードの有無にかかわらず、ページのパフォーマンスをテストします。
サードパーティサービスからのランダムなポップアップなど、特定のサードパーティサービスが読み込まれないようにします。
パフォーマンスの問題を引き起こすことが知られているファイルは無視します。
除外ルールを作成するには:
ブラウザテストの設定ページで、Advanced トグルを選択します。
Custom content セクションに下にスクロールします。
Add excluded file を選択します。
File type で値を選択します:
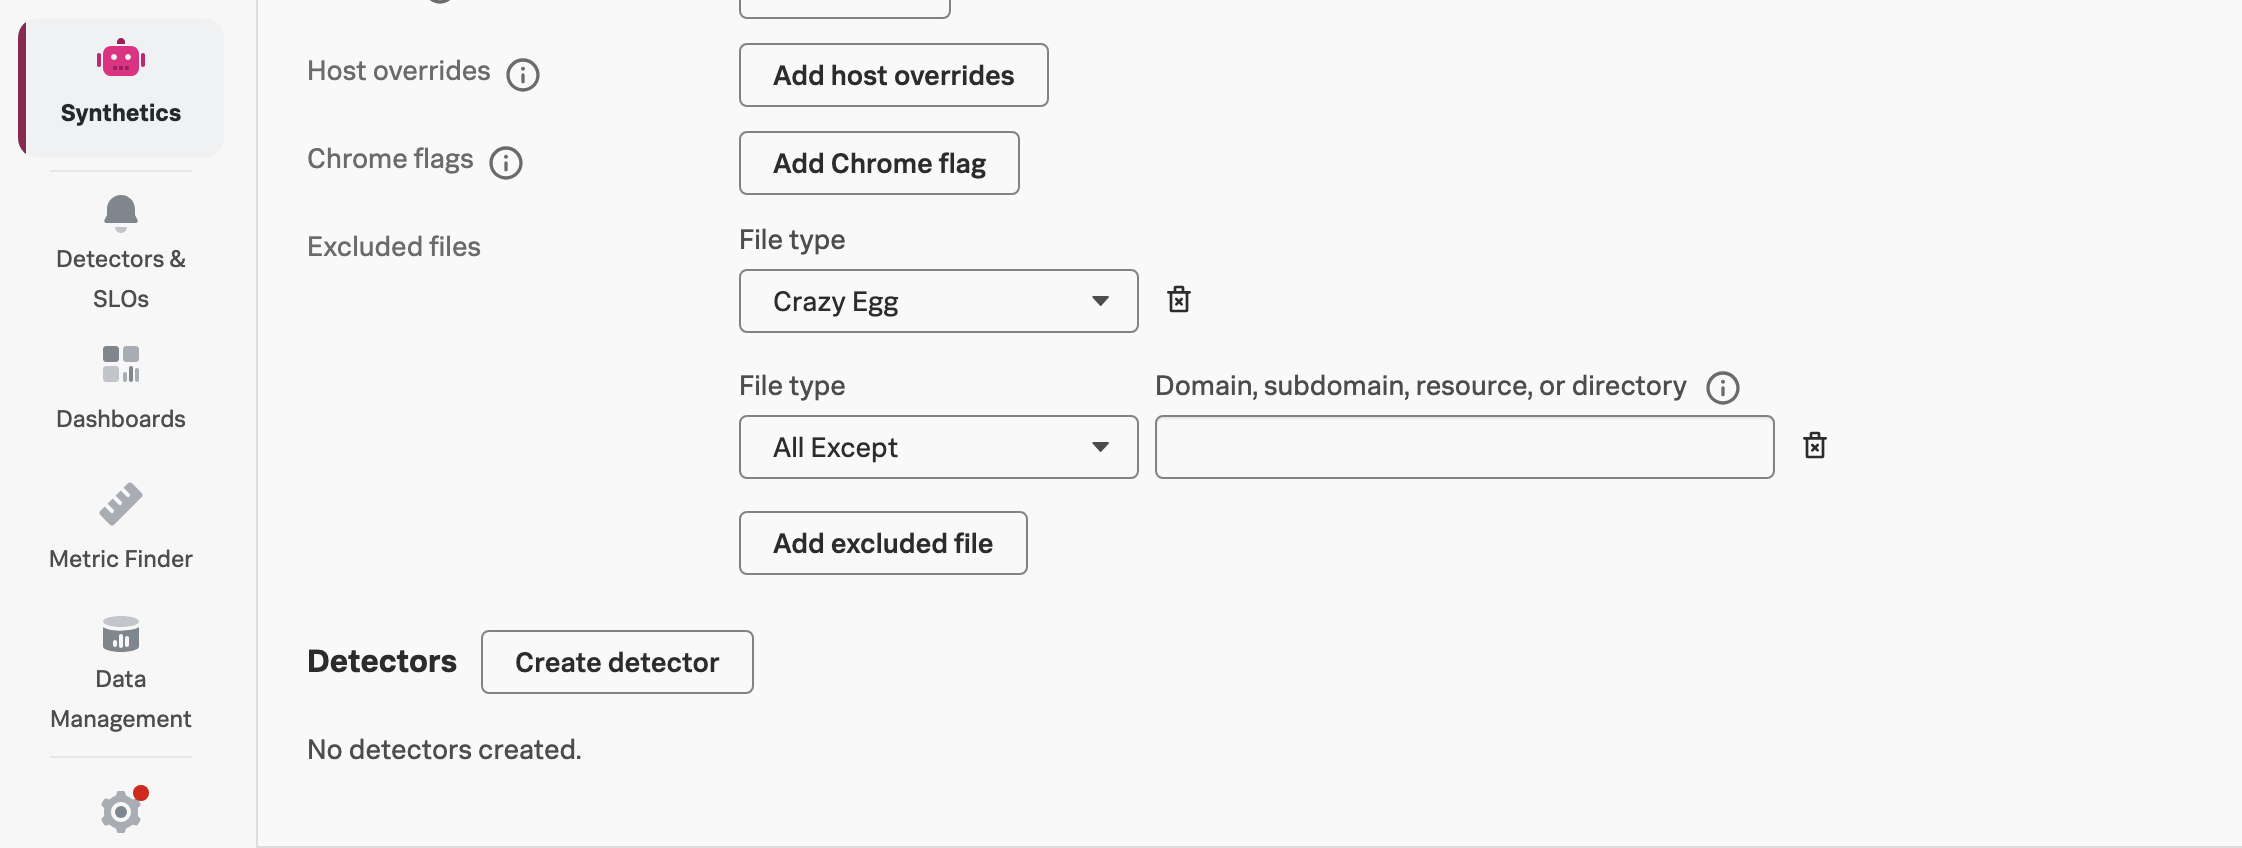
事前に定義された共通のタイプのファイルをすべて除外するには、そのタイプを選択します。
指定した値に一致するファイルタイプ以外のすべてのファイルタイプを除外するには、All Except を選択し、値または正規表現を指定します。
正規表現を使用するには、Custom を選択し、値または正規表現を指定します。例:
すべてのサブドメインを含む特定のドメインを除外するには、
domainname\.comを入力します。ドメインそのものではなく、特定のドメインのサブドメインだけを除外するには、
.+\.domainname\.comを入力します。JavaScriptアプリを除外するには、
domainname\.com/appname\.jsを入力します。ディレクトリ全体を除外するには、
domainname\.com/directoryname\/.+を入力します。
注釈
All Except 除外項目は他の除外項目より優先されます。 All Except と Custom を組み合わせて使用する場合を除き、除外項目を指定する順番は重要ではありません。
カスタムプロパティ 🔗
詳細設定のテスト作成ページでカスタムプロパティを追加します。キーと値のペアを使用してカスタムプロパティを作成し、ダッシュボード、チャートをフィルタリングおよびグループ化し、アラートを作成します。テストに関連付けられているタグに基づいて、テストごとにカスタムプロパティの候補リストが表示されます。例: env:test、role:developer、product:rum。複数のキーと値のペアがある場合、ロジックは結果間の AND になります。つまり、この場合、環境テストで開発者ロールを持つ RUM 製品のすべてのテストが結果に表示されます。
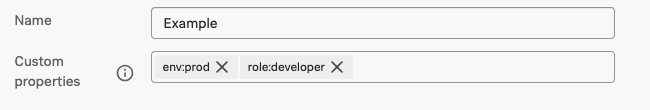
カスタムプロパティは単一値であり、region:eu, us のような複数値には対応していません。各テストで使用できるキーは一意です。例えば、env1:test と env:test を同じテスト内に持つことはできますが、 env:test と env:prod を持つことはできません。
主な要件:
キーは大文字または小文字で始めなければなりません。特殊文字や数字でキーを始めることはできません。
キーの残りの部分には、文字、数字、アンダースコア、ハイフンを含めることができます。
キーに
test_idやtestという名前を付けることはできません。キーサイズは128文字以内です。
カスタムプロパティ を参照してください。
例 🔗
例については、シナリオ:ブラウザテストを使用するマルチステップワークフローを監視する を参照してください。