SignalFlowを使用した受信データの分析 🔗
Splunk Observability Cloud UIでSignalFlowを使用すると、チャートとディテクターの分析を改善できます。
UIからのSignalFlowプログラムの実行 🔗
Splunk Observability CloudのユーザーインターフェイスからSignalFlowプログラムを追加して、処理されたデータをディテクターやチャートにストリーミングすることができます。
ディテクターの編集時にSignalFlowプログラムを編集するには、アラートをトリガーするディテクターを作成する を参照してください。
チャートの編集時に SignalFlow 関数を使用するには、Splunk Observability Cloudの分析リファレンス を参照してください。
注釈
SignalFlow APIを使用して、SignalFlowプログラムを追加することもできます。SignalFlow APIを使用する を参照してください。
ストリーム・オブジェクトを処理する 🔗
SignalFlowプログラムはストリーム・オブジェクトを処理し、ディメンションに沿って整理されたタイムスタンプ値を生成します。生のメトリック時系列データは分析ジョブにストリーミングされ、SignalFlowを通じて指定されたクエリと計算が新しいストリームを生成します。たとえば、母集団全体または時間にわたって計算された統計です。
ストリームは、特定の分析クエリまたは計算に対してローカルであり、複数の異なるジョブが、同じ基礎となるメトリック時系列データに対してクエリーを実行する可能性があります。ディテクターは、1つまたは複数のストリームに関係する条件(通常は一定期間にわたるストリーム間の比較)を評価します。たとえば、「ディスク使用率が10分間の90%で80%を超えている」、「データベースの平均待ち時間が5秒を超え、データベースの呼び出し回数が1日平均の少なくとも20%である」などがディテクターの条件となります。
ストリーム・オブジェクトの詳細については、変数としてのストリーム を参照してください。
カスタム分析の作成 🔗
カスタムチャートやディテクター分析を作成したい場合は、『Splunk Observability Cloud 開発者ガイド』の SignalFlowを使用してデータを分析する を参照してください。
SignalFlow プログラムを直接実行することもできます。詳細については、Splunk Observability Cloud Developer Guide の SignalFlow API トピックを参照してください。
データの集約と変換 🔗
ほとんどの組み込み 分析関数、集計と変換の2つの方法で、チャートやディテクターの時系列に対して計算を実行できます。
例えば、時刻 t、t+1、t+2 における5台のサーバーグループの平均 CPU 使用率などです。集約の出力は、単一の メトリック時系列 (MTS)であり、各データポイントは、特定の期間におけるすべてのデータポイントの集約を表します。詳細については、集計 を参照してください。
集計には、Group Byという追加オプションが利用できます。group-byフィールドが指定された場合、group-by基準で指定されたプロパティの MTS 共有値が一緒に集計されます。たとえば、平均 CPU負荷を AWSインスタンスタイプ別にグループ化して計算できます。Mean関数を集計として追加し、AWSインスタンスタイプをgroup-by基準として設定します。出力には、AWSインスタンスタイプごとに1つのMTSが表示されます。
変換は各 MTS に対し時間ウィンドウ上で並列に実行され、各入力時系列に対し1つの出力時系列が得られます。たとえば、ローリングウィンドウ上の5台のサーバーの1日の平均 CPU 使用率は、5つの MTS を表示し、各出力値はその MTS の過去24時間の移動平均となります。詳細については、変換 を参照してください。
利用可能な3種類の変換、移動ウィンドウ、カレンダー・ウィンドウ、ダッシュボード・ウィンドウについては、以下のセクションを参照のこと。チャートでの変換分析の使用例については、チャートの分析によってインサイトを取得する を参照してください。
移動ウィンドウの変換 🔗
以下の移動ウィンドウ変換チャートの例では、各線は4台のサーバーの平均 CPU 使用率を表しています。灰色の線は、直前1分間の各データポイントの平均値を表します。マゼンタの線は、直前の1時間のローリングウィンドウにおける各データポイントの平均値を表します。

ローリング・ウィンドウ変換の詳細については、ローリング・ウィンドウ変換 を参照のこと。
カレンダー・ウィンドウの変換 🔗
次の例では、Sum、Mean、Maximum、Minimum 関数で、変換のカレンダー・ウィンドウを設定できます。このチャートでは、マゼンタの線が1週間の移動ウィンドウにおける全トランザクションの合計を示しています。緑色の線は、1週間を通して計算された部分的な値を含む、暦上の1週間の取引の合計を示します。値は1週間かけて増加し、翌週の初めにリセットされます。

カレンダー・ウィンドウの変換の詳細については、カレンダー・ウィンドウの変換 を参照してください。
解像度に関する考察 🔗
プロットにカレンダー・ウィンドウを持つ関数を追加し、現在の時間ウィンドウが関数で指定したサイクル長より狭い場合、チャートは少なくとも1サイクルのデフォルト時間にリサイズされます。同時に、時間範囲に関するダッシュボードのオーバーライドはすべて削除されます。最適化を知らせるメッセージが標示されます。この最適化を受け入れない場合は、期待するデータを見るために時間範囲を手動で変更する必要があるかもしれません。
チャートがカレンダー・サイクルの終わりに値を表示するには、サイクルの長さが解像度の倍数でなければなりません。詳しくは、解像度 を参照してください。
時間範囲とチャート表示の解像度の組み合わせによっては、チャートがサイクル境界に完全に一致した値を表示することを保証する解像度を使用できない場合があります。例えば、解像度を1日にすると、チャート上に表示できるデータポイント数を超えてしまう場合、解像度を2日にしなければならないことがあります。これは、プロットされた値が29日または31日の月の終わりと一致しないことを意味します。なぜならどちらの値も解像度2日の倍数でないからです。このような状況は、チャートの解像度ピルがオレンジ色になり、ツールチップにメッセージが表示されることで示されます。この問題は、表示解像度を変更するか、より狭い時間範囲を表示することで解決できます。
注釈
カレンダーの時間ウィンドウを変換で使用する場合、チャートの解像度は1時間より細かくできません。
サイクルの長さと開始 🔗
サイクルの長さには、時間、日、週、月、四半期のオプションがあります。
ほとんどのサイクル長オプションでは、開始点を指定できます。例えば、サイクルの長さを四半期にする場合、最初の四半期の開始をデフォルトの1月ではなく、2月に指定できます。例外は、1時間単位のサイクル長です。1時間単位のサイクルは、常に時の先頭(0分)から始まります。
カレンダーのタイムゾーン 🔗
カレンダー・ウィンドウでは、カレンダー・タイムゾーンを指定する必要があります。カレンダー・タイムゾーンはチャートごと(またはディテクターごと)の設定で、ユーザープロファイルで設定されている表示タイムゾーンとは独立しています。カレンダー・ウィンドウに設定したタイムゾーンは、選択したカレンダー・ウィンドウ・サイクルの正確な開始と終了を決定します。
例えば、アメリカ/ロサンゼルスの1月は、アジア/東京の1月とは異なる時間に始まります。もしSplunk Observability Cloudが12月31日のUTC時間午前0時付近のタイムスタンプを持つデータポイントを受信した場合、カレンダーのタイムゾーンによって、そのデータポイントが12月の計算にカウントされるか、1月の計算にカウントされるかが決まります。
チャート内のすべてのカレンダー・ウィンドウ関数は、同じカレンダー・タイムゾーンを共有します。チャートのどのプロット上でも、カレンダー・ウィンドウ関数を初めて追加すると、プロファイルのビジュアライゼーション・タイムゾーンが、カレンダー・タイムゾーンに使用する値として提案されます。
部分的な値を隠す 🔗
Hide partial values 設定により、カレンダー・ウィンドウ関数の出力を最適化することができます。これは、サイクルの終了時に計算された最終的な値と、サイクル中に計算された部分的な値のどちらに関心があるかに基づきます。たとえば、サイクルの長さが1日の場合、部分的な値を非表示にすると、各日の値が1つだけ表示されます。
注釈
カレンダー・ウィンドウを使用するチャートは1時間より細かい解像度を持つことができないため、サイクルの長さが1時間の場合、このオプションの選択を解除しても効果はありません。
以下の例では、部分的な値(マゼンタの棒グラフ)を非表示にすることで、1日単位での値の比較の概要がより明確になります。部分的な値(緑色の線)を非表示にすることで、各日の平均値がどのように変化するかを表示します。

各サイクルの開始時の値は、前サイクルの最終値を表します。2月15日午前0時のマゼンタ色の列は、2月14日の平均値を表します。2月16日午前12時の列は、2月15日の値の平均を表し、以下同様です。
注釈
単一値チャートは、現在までに報告された最大待ち時間などの計算を視覚化するのに便利です。これらの数値を適切に表示するには、Hide partial values の選択を解除してください。
カレンダー・ウィンドウのタイムシフト 🔗
timeshift 関数は、入力ストリームの各 MTS のデータポイントをシフトし、指定した期間だけオフセットします。timeshiftを使用する典型的なユースケースは、ある期間のメトリクスの平均値と、その前の期間に測定された平均値とを比較することです。SignalFlow関数の詳細については、timeshift() を参照してください。
タイムシフトは、部分的な値が非表示になっている場合にのみ有効です。カレンダー・ウィンドウを使用しているときにタイムシフトを有効にすると、各カレンダー・サイクルの終わりに、前のサイクルの終わりの値が表示されます。例えば、サイクルの長さが月で、1サイクルずつタイムシフトする場合、4月30日のデータポイントは3月31日の値を表し、5月31日のデータポイントは4月30日の値を表します。
注釈
チャートのタイムシフト機能は、3月が2月より日数が多いというような、可変長のサイクルを認識し、前の間隔の終わりに正しくシフトします。対照的に、スタンドアローンのタイムシフト分析機能は、30日のような固定幅のシフトを行います。詳しくは Timeshift関数を使って傾向を把握する を参照してください。
ダッシュボード・ウィンドウの変換 🔗
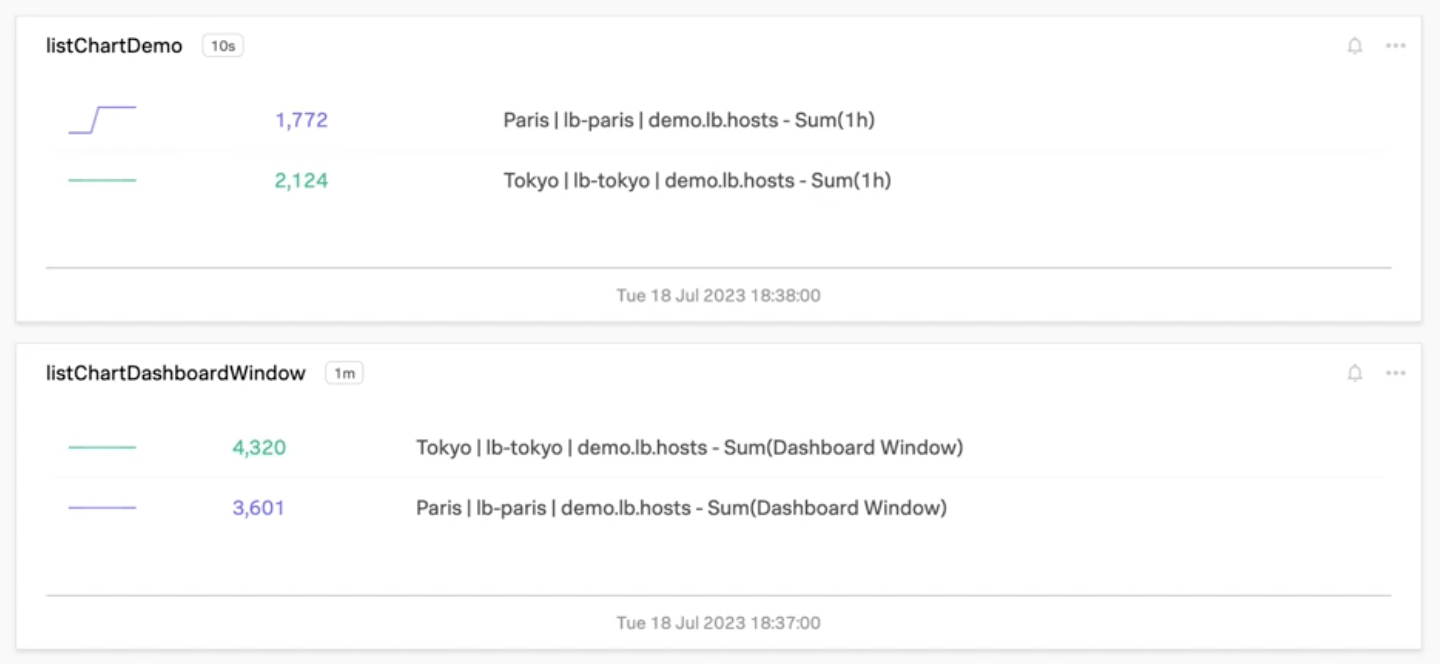
次の例では、同じダッシュボードの両方のチャートが、異なるリージョンにあるロードバランサーのホストの総数を示しています。過去1時間のデータに基づくと、東京リージョンには2124のホストがあり、パリリージョンには1772のホストがあります。

2つのチャートの違いは、listChartDemo のチャートにはダッシュボード・ウィンドウの変換が設定されていないのに対し、listChartDashboardWindow のチャートには設定されていることです。
ダッシュボードの Time ピッカーを調整すると、listChartDashboardWindow のチャートだけが、選択した時間範囲に従って値を更新します。例えば、-12h の時間範囲を選択すると、チャートは過去12時間のデータを表示します。
ダッシュボード・ウィンドウの変換の詳細については、ダッシュボード・ウィンドウの変換 を参照してください。
注釈
ディテクターにダッシュボード・ウィンドウの変換を適用することはできません。ダッシュボードのウィンドウ変換を使用するチャートから新しいディテクターを作成すると、変換ウィンドウはダッシュボードの現在の時間ウィンドウに最も近いものに更新されます。
例えば、ダッシュボードの現在の時間ウィンドウは 09/01/2023 09:25:00 am to 09/02/2023 07:30:00 am です。このダッシュボードのチャートから新しいディテクターを作成すると、変換ウィンドウは Past day (-1d) になります。
その他の関数 🔗
集計と変換を提供する関数に加え、SignalFlowは、値を持つMTSの数をカウントする Count、値の最高または最低N数を表示する Top、Bottom、時系列をソース別ではなく値別にフィルタリングする機能を提供する Exclude、などの関数を提供します。
他の分析関数と同様に、これらの関数は他の関数と組み合わせて使用することで、より高度な計算を行うことができます。例えば、Exclude は、Sum と一緒に使うことで、一般的な表計算アプリケーションで見られる sumif() 関数のような結果を得ることができます。
各機能の詳細については、Splunk Observability Cloudの分析リファレンス を参照してください。
式 🔗
SignalFlowでは、先行する計算を変数として参照する式を作成できます。例えば、受信したHTTPレスポンスコードのうち、2xxと4xxまたは5xxの比率を計算することができます。