MTTAおよびMTTRレポート 🔗
レスポンスメトリクスのMTTA (平均確認時間)とMTTR (平均解決時間)レポートは、Splunk On-Callへの投資とDevOpsの実践を物語ります。時間の経過に伴う進化と目標を追跡し、ダウンタイムのコストに直接関連する主要メトリクスを伝えることで、主要なステークホルダーにストーリーを伝えることができます。
Reports に移動し、次に Response Metrics に移動します。
レスポンスメトリクスのグラフ表示 🔗
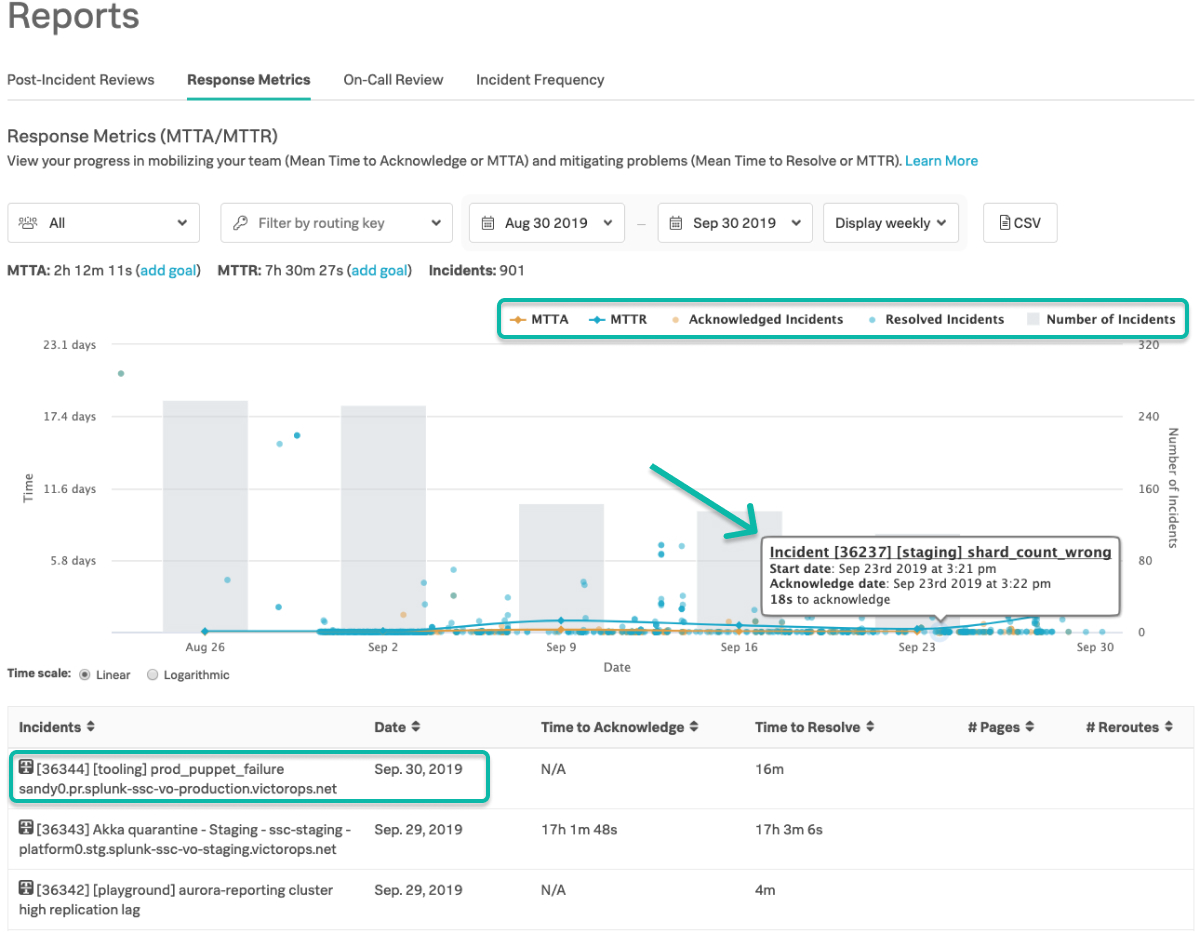
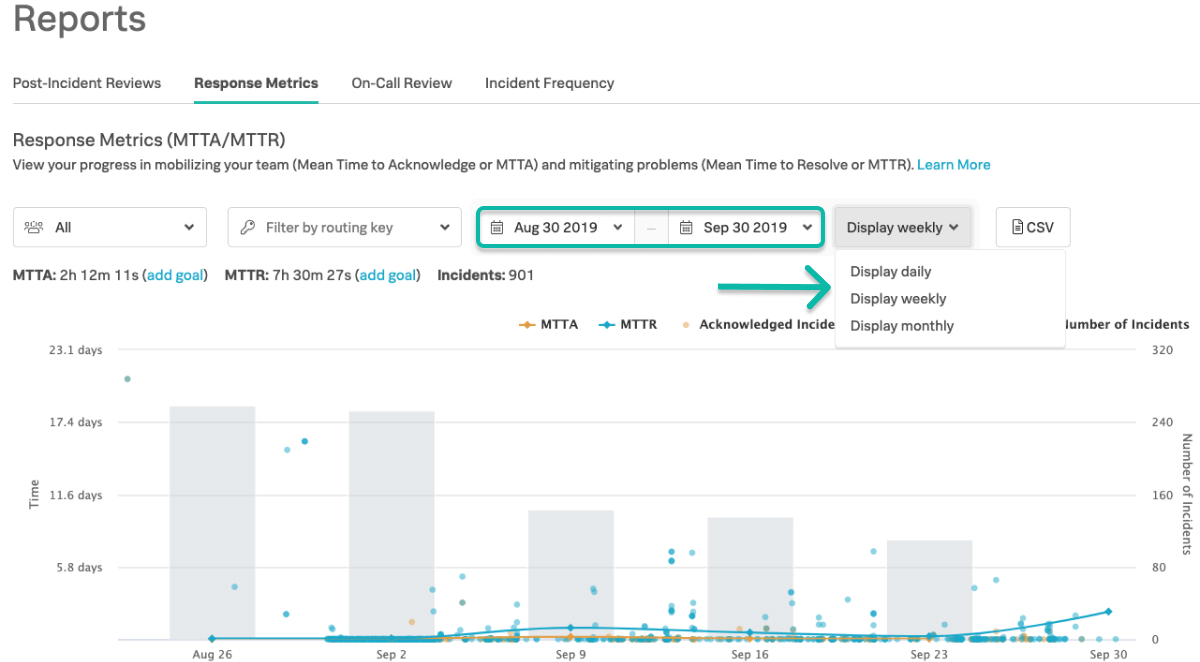
デフォルトでは、特定の期間にインシデントが存在する場合、MTTAおよびMTTRの線がグラフビューに表示されます。インシデントは縦列で表示され、特定の時間枠で集約されたインシデント数を中継すると同時に、時間範囲を構成する個々のインシデントも表示します。
グラフキーで項目を選択または選択解除して、重要なデータポイントを含めます。
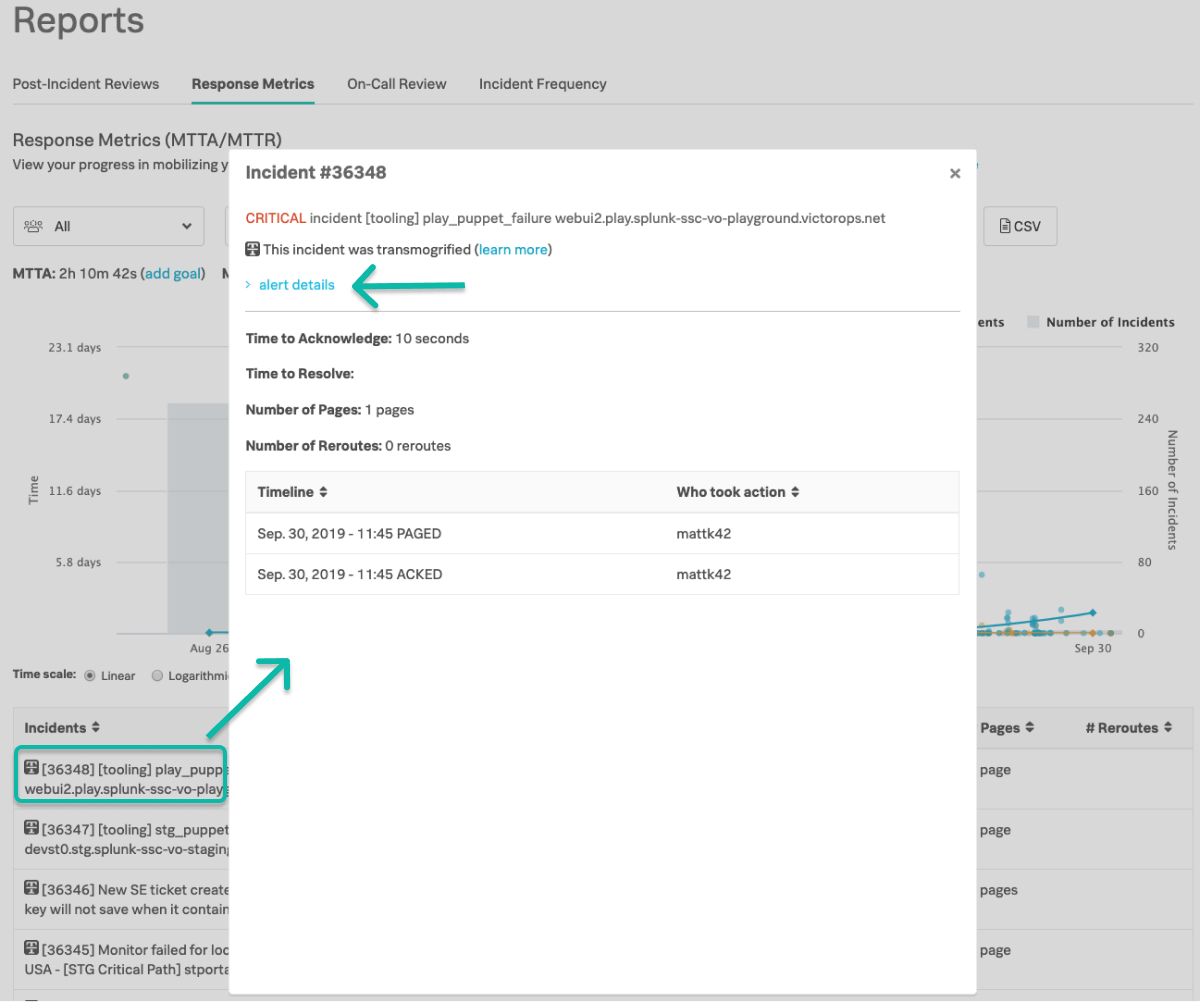
インシデントの上にカーソルを置くと、主要なメトリクスを知ることができ、個々のインシデントをクリックすると、特定のデータポイントにまつわる詳細な情報を得ることができます。バケット平均については、ホバー状態のみが利用可能です。
個々のインシデントを選択して、より詳細なインシデントデータにドリルインすることができます。
グラフキーで項目を選択または選択解除して、重要なデータポイントを含めます。
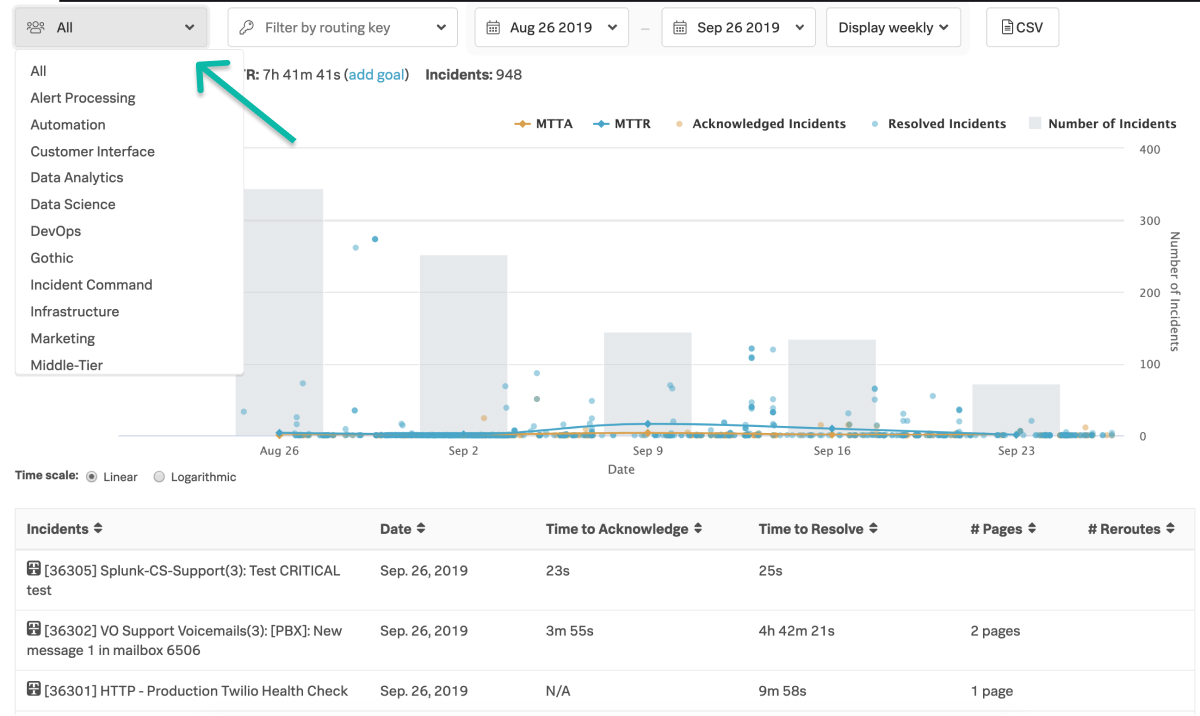
チームのフィルターリングによるレスポンスメトリクスの追跡 🔗
チームフィルターを活用して、組織とチームのMTTA、MTTR、およびインシデントメトリクスの両方を追跡します。これらは、関連するチームのエスカレーションポリシーに直接関連します。
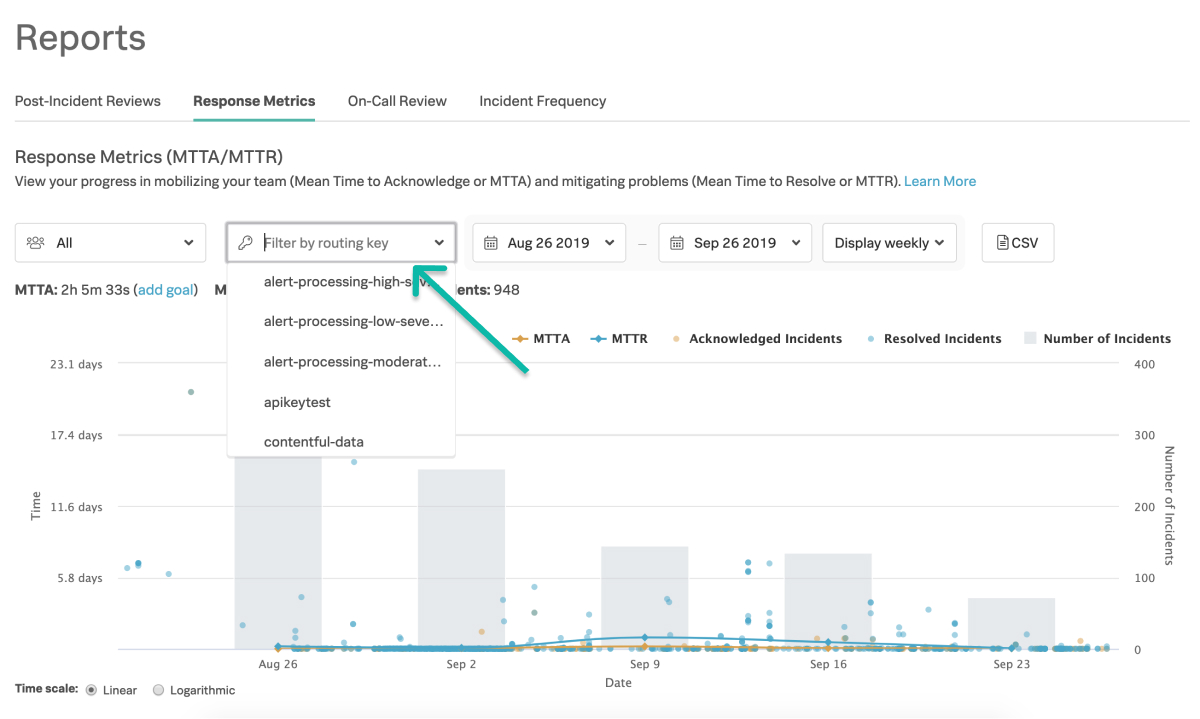
ルーティングキーフィルターリング 🔗
特定または複数のルーティングキー をターゲットにして異なるコンポーネントに関するメトリクスを理解します。
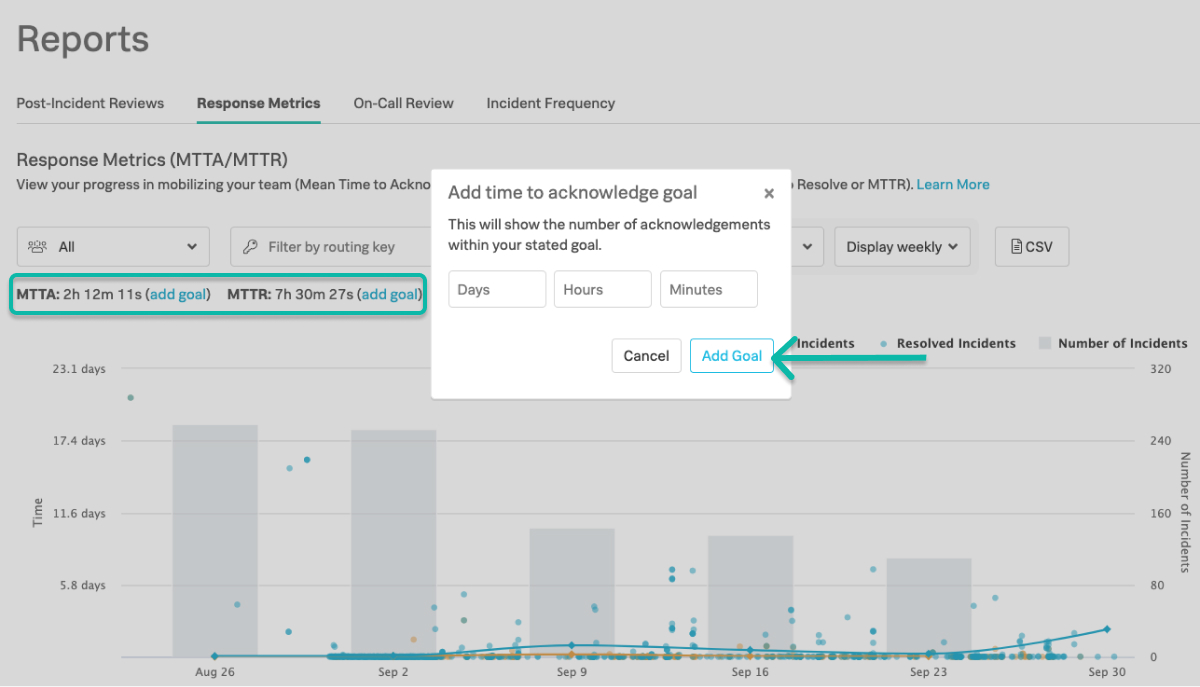
MTTAとMTTRの目標追跡 🔗
MTTAおよびMTTR目標に対する具体的な目標を追加します。日次、週次、月次のバケット化単位でこれらを追跡します。
注:目標はユーザー単位でのみ保存され、組織全体では保存されません。
日付範囲とバケット化によるインシデント量 🔗
MTTAとMTTRの平均値とインシデント件数を日、週、月のバケットごとに集約します。
最近のインシデントのテーブルビュー 🔗
テーブルビューは、選択したセグメントフィルターに関連する最新の100件のインシデントに合わせて調整されます。特定の行をクリックすると、ACK/RES履歴や個々のアラートペイロードなど、特定のインシデントの詳細が表示されます。
CSVダウンロード 🔗
CSVで配信されるデータは、設定ビューで設計された日付範囲とチームセグメントが反映されます。フィルターによるセグメントや日付範囲のバケット化を変更しても、ダウンロードの内容には影響しません。
CSVについての留意点:
タイムスタンプの粒度はミリ秒単位です
CSVはインシデントIDの降順でソートされます。
CSVファイルの列見出し 🔗
レスポンスメトリクスCSVファイルをダウンロードする際、インシデントが記録された時間/タイムゾーンの単位を含む以下の列を見つけることができます。時間関連の列見出しは、この形式で表示されます:
確認時間(秒)解決時間(秒)インシデント開始時間(UTC)確認時間(UTC)解決時間(UTC)