インシデント対応 🔗
Splunk Observability Cloudで利用可能ないくつかのツールを使用して、インシデントの根本原因を掘り下げることができます。以下のセクションで、Splunk Observability Cloudの各コンポーネントがインシデント対応ツールとしてどのように有効であるかを確認してください。
Splunk Observability Cloudを他のSplunkプラットフォーム製品と併用する方法については、Splunk Observability CloudとSplunkプラットフォームのシナリオ のユースケースサンプルを参照してください。
アラートとディテクター 🔗
Splunk Observability Cloudのアラート、ディテクター、イベント、通知を使用して、特定の基準が満たされたときに情報を届けます。多くの場合、インシデントの発生は、アラートとディテクターによって最初に認識されます。Splunk Observability Cloudには、AutoDetect、または、サポート対象のインテグレーション用のビルトインのアラートおよびディテクターがあります。詳細については、AutoDetect を参照してください。
さらに、チームはディテクターを作成して、チームにとって最も重要なパフォーマンスと閾値についてアラートを出すことができます。たとえば、サーバーのレイテンシが高くなりすぎているなど、SLO で設定した制限値にシステムが近づいたときに、アラートとディテクターを使用してチームに通知できます。アラート、ディテクター、閾値、およびこれらの相互作用のしくみについては、Splunk Observability Cloudのアラートとディテクターの概要 を参照してください。
アラートとディテクターを積極的に使用してシステムの変化に関する情報を常に把握しておけば、ユーザーが経験するインシデントの数を減らし、設定した静的閾値または動的閾値をイベントが超えたときにシステムを更新することで、将来のチームの労力を軽減することができます。
Splunk Observability Cloudの「アラート」のホームページでは、AutoDetectのアラートやカスタムアラートを含むすべてのアラートを確認できます。組織の「アラート」ホームページに移動するには、Splunk Observability Cloudにログインし、左のナビゲーションメニューで アラート を選択します。次のスクリーンショットは、「アラート」ホームページを示しています。
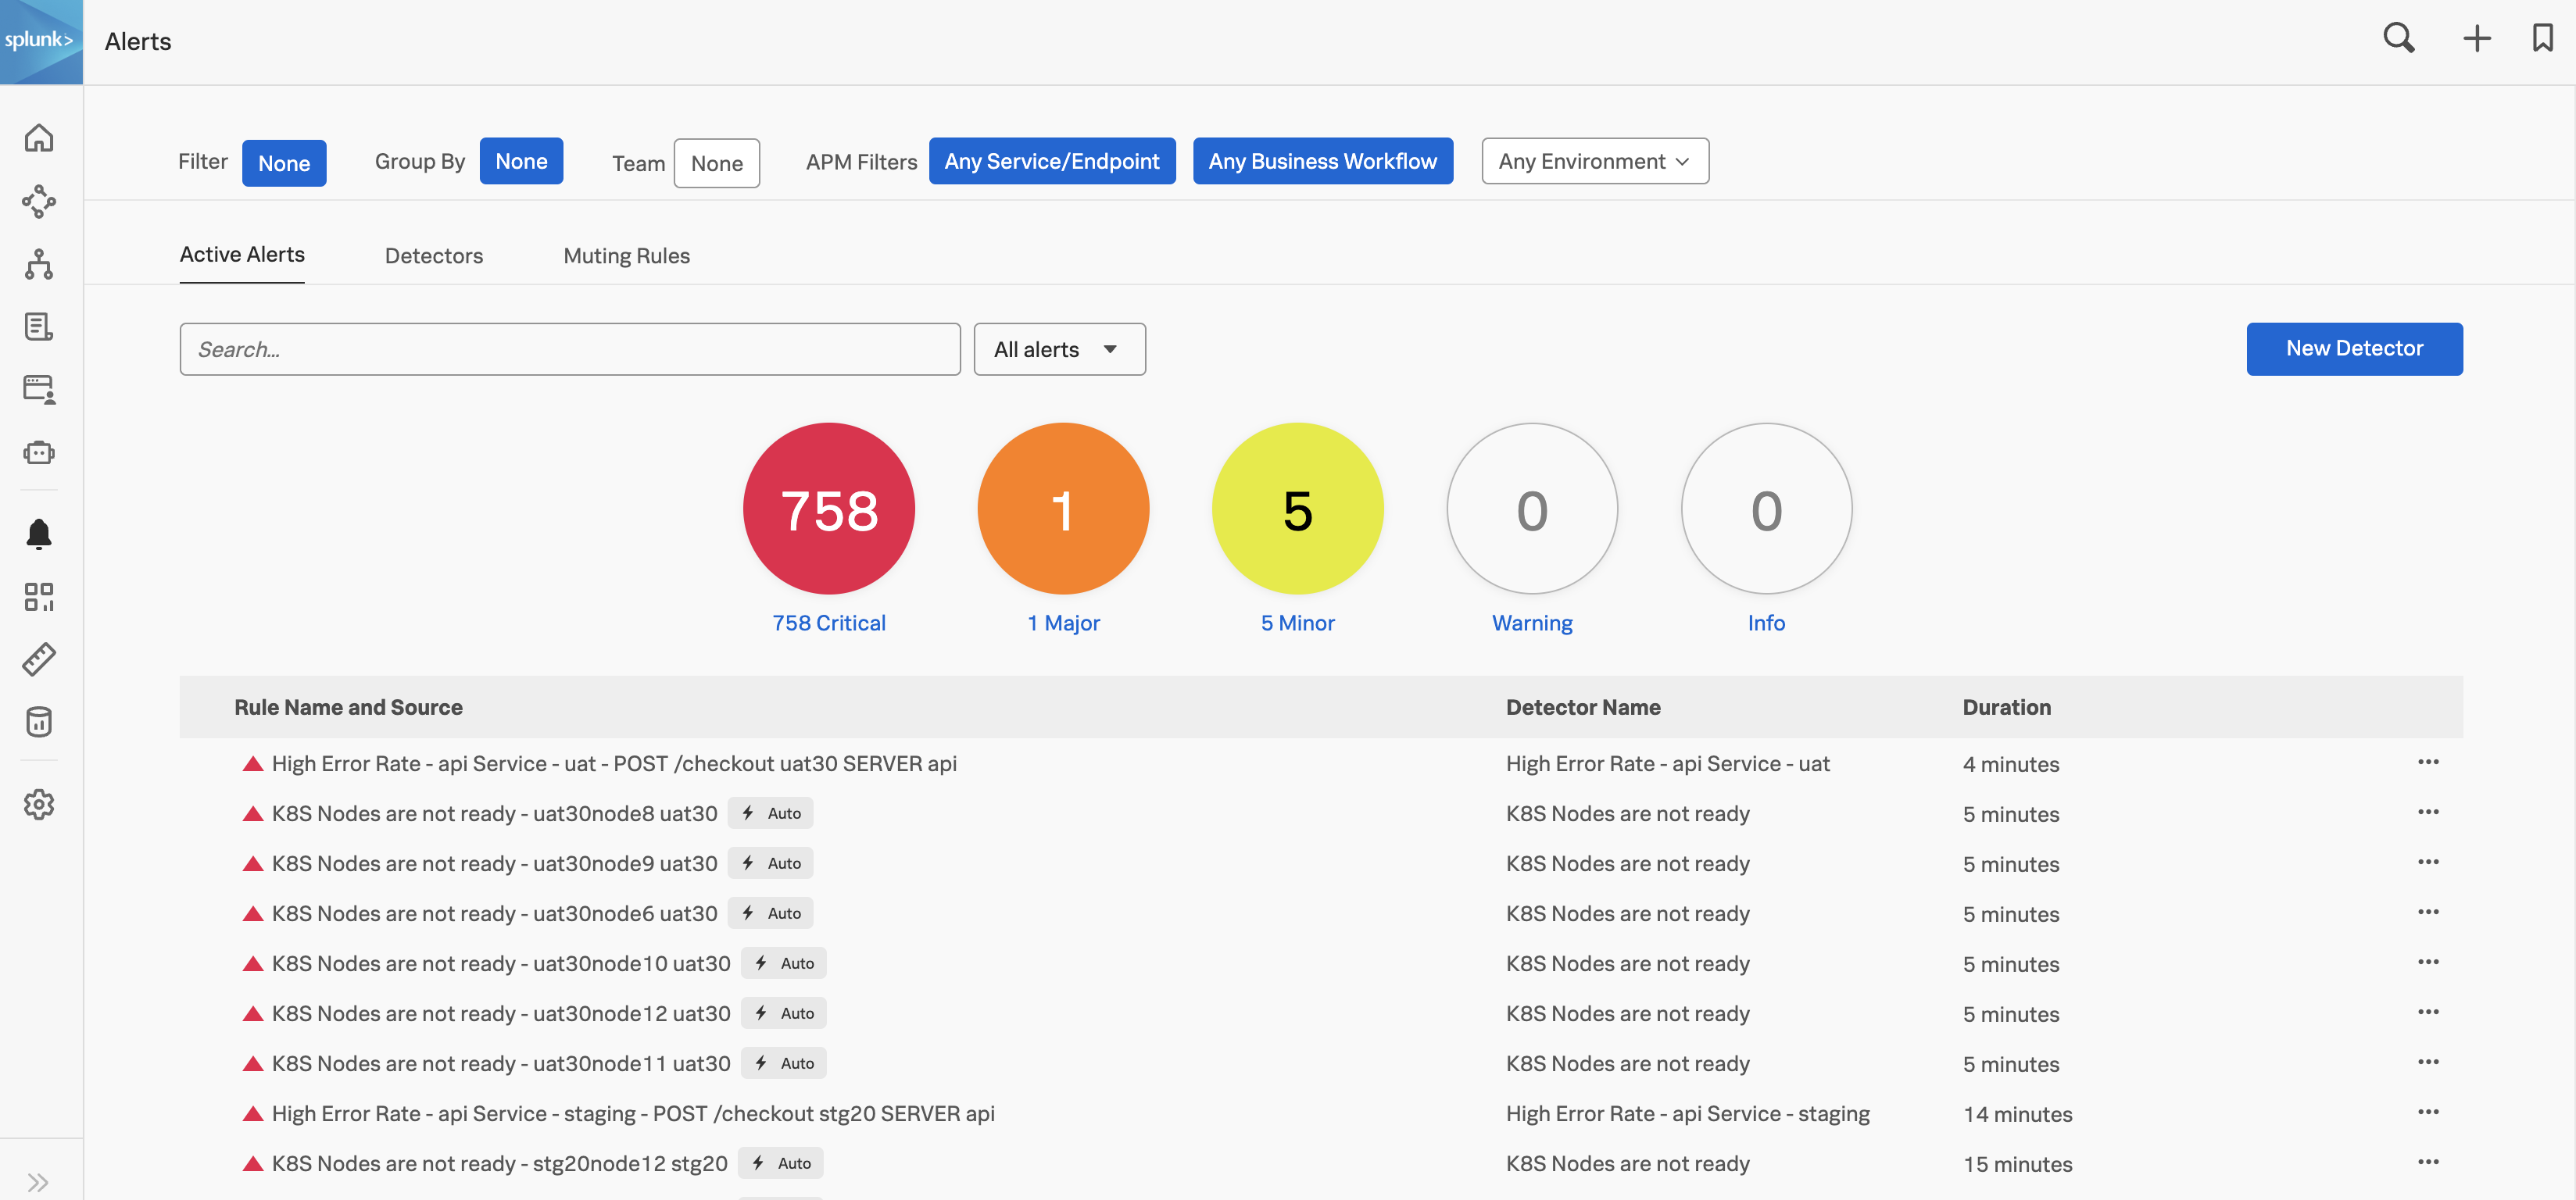
AutoDetectは、サポート対象のインテグレーションに対するSplunk Observability Cloudの自動検出機能を有効にします。サポート対象のインテグレーション用のシステム接続とデータ送信を完了すると、すべてのインテグレーションの通知の受信登録ができます。詳細については、AutoDetectアラートおよびディテクターの使用とカスタマイズ を参照してください。あわせて 利用可能なAutoDetectディテクターのリスト も参照してください。
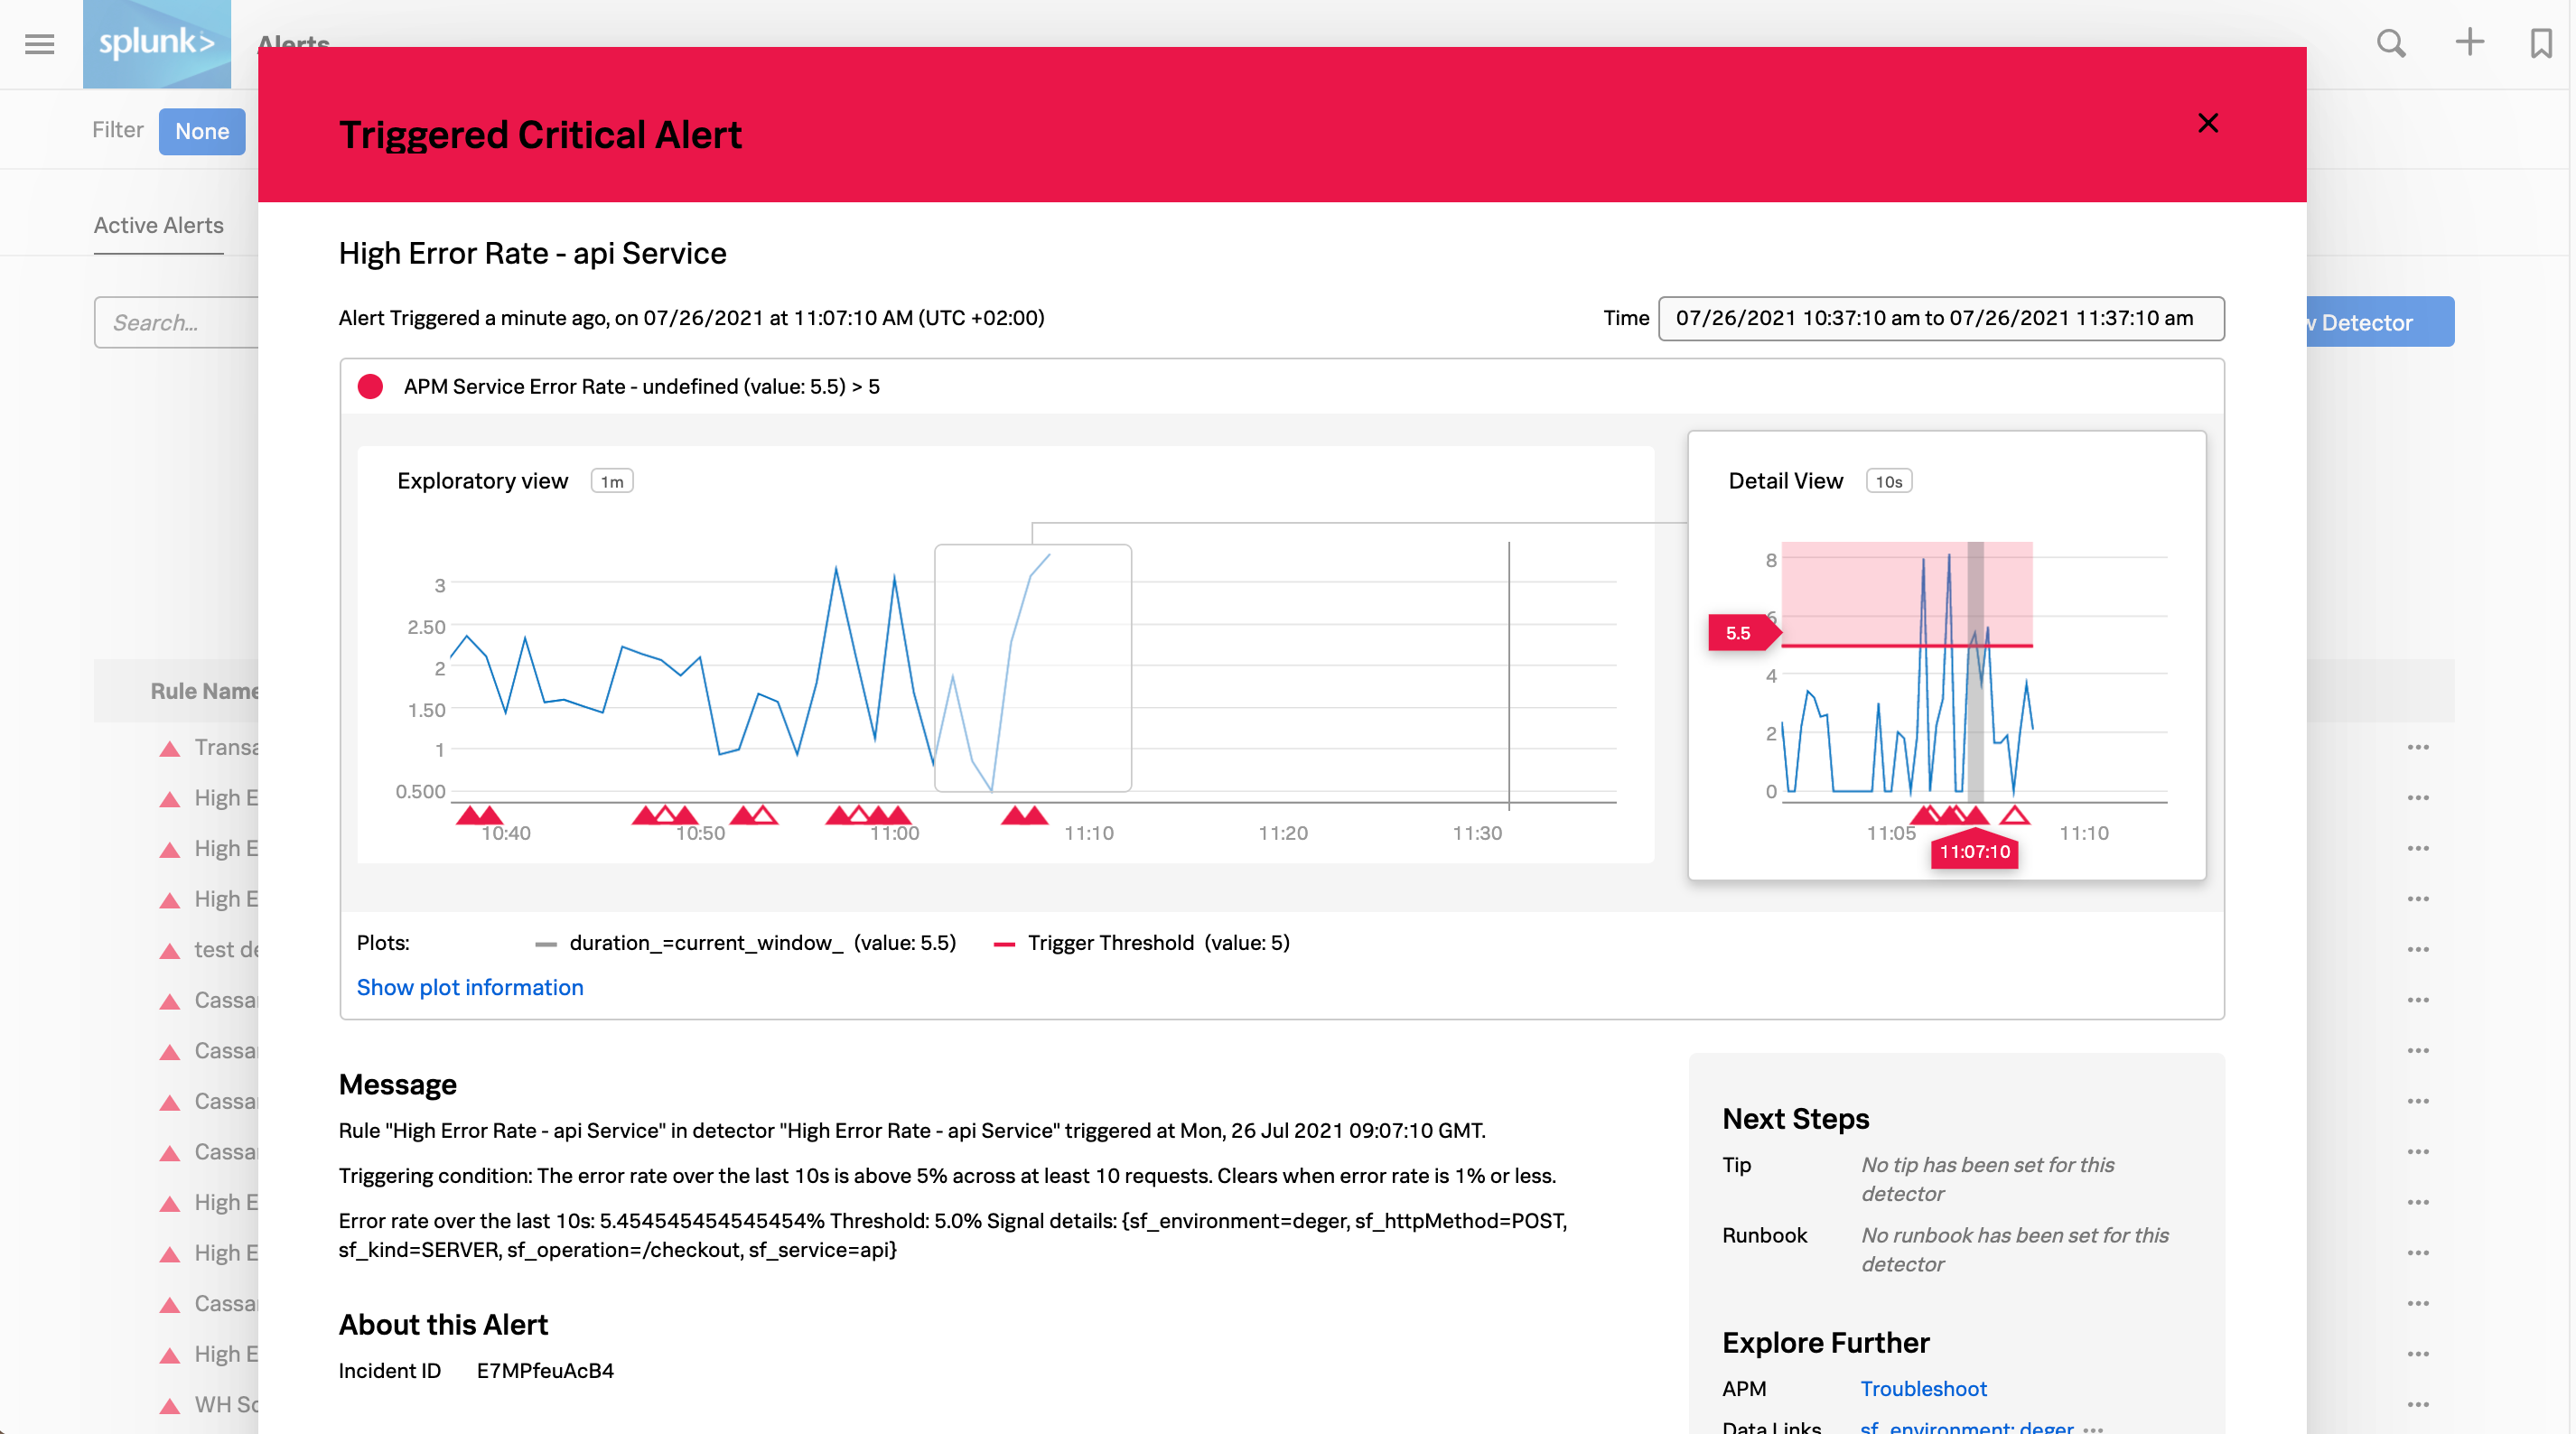
任意のアラートを選択すると、詳細情報と、そのエラーのトラブルシューティングに使用できるSplunk Observability Cloudコンポーネントへのリンクが表示されます。以下に示す「クリティカル」のアラートは、高いAPIエラー率を示しています。右側のパネルの 詳しく調査 のセクションには、問題のトラブルシューティングを実行できるAPMに移動するためのリンクが表示されています。
サーバーのレイテンシの増加、高いCPU使用率、システム上限への接近、ユーザーエクスペリエンスに悪影響を及ぼすその他の状況について、アラートを使用してチームに通知する方法の例については、アラートとディテクターを使用してインフラストラクチャの問題を発見し解決するシナリオ を参照してください。
ダッシュボード 🔗
Splunk Observability Cloudのコンポーネントはすべて、Splunk Observability Cloudのダッシュボードでのデータ分析に寄与します。APM、Infrastructure Monitoring、RUMでは、チャートとダッシュボードを表示できます。また、すべてのSplunk Observability Cloudダッシュボードのホームページにアクセスすると、ログビューやチャートに表示されるログデータなど、各コンポーネントに作成されたダッシュボードやチャートを見ることができます。
Splunk Observability Cloudには、ビルトイン(内蔵)ダッシュボード、カスタムダッシュボード、ユーザーダッシュボード、ダッシュボードグループがあります。詳細は Splunk Observability Cloudのダッシュボードとダッシュボードグループのタイプ を参照してください。ビルトインダッシュボードの詳細については、ビルトインダッシュボード も参照してください。ダッシュボードには、システムに関する有用で実用的なインサイトを一目で取得できる重要な情報が含まれています。SLOの監視に役立つカスタムのダッシュボードやチャートを作成することも、見たいデータを掘り下げるための数個のチャートのみを含むシンプルなダッシュボードを作成することもできます。次の例は、サポート対象の多くのインテグレーションについてレポートする数十個のビルトインダッシュボードを含む、ある組織のダッシュボードを示しています。ユーザーがあるダッシュボードを選択すると、このダッシュボードに保存されているすべてのチャートが表示され、興味深い傾向や予期しない変動を示すチャートをすばやく掘り下げることができます。
ダッシュボードを表示するには、Splunk Observability Cloudにログインし、左のナビゲーションメニューから ダッシュボード を選択します。
Splunk APM 🔗
APMはトレースとスパンを収集し、分散アプリケーションを監視します。サービスマップを使用してエラーの根本原因を調査したり、Tag Spotlightを使用してエラーの根本原因を見つけることができます。その方法については、シナリオ:KaiがSplunk APMのサービスマップを使用してエラーの根本原因を調査する と シナリオ:DeepuがTag Spotlightを使用してエラーの根本原因を見つける を参照してください。その他のAPMトラブルシューティングのシナリオ例については、Splunk APMを使用したエラーのトラブルシューティングとアプリケーションパフォーマンスの監視のシナリオ を参照してください。
Database Query Performance 🔗
データベースのクエリが遅いことも、サービスの可用性に関わる広範な問題の原因となります。データベースのクエリ時間が可用性やレイテンシに関するインシデントの原因になっていないかどうかを評価することで、インシデントに迅速に対応できます。Database Query Performanceの監視 を参照して、データベースのパフォーマンスを確認してください。次の画像は、ある組織の「データベースクエリパフォーマンス」ダッシュボードを示しています。
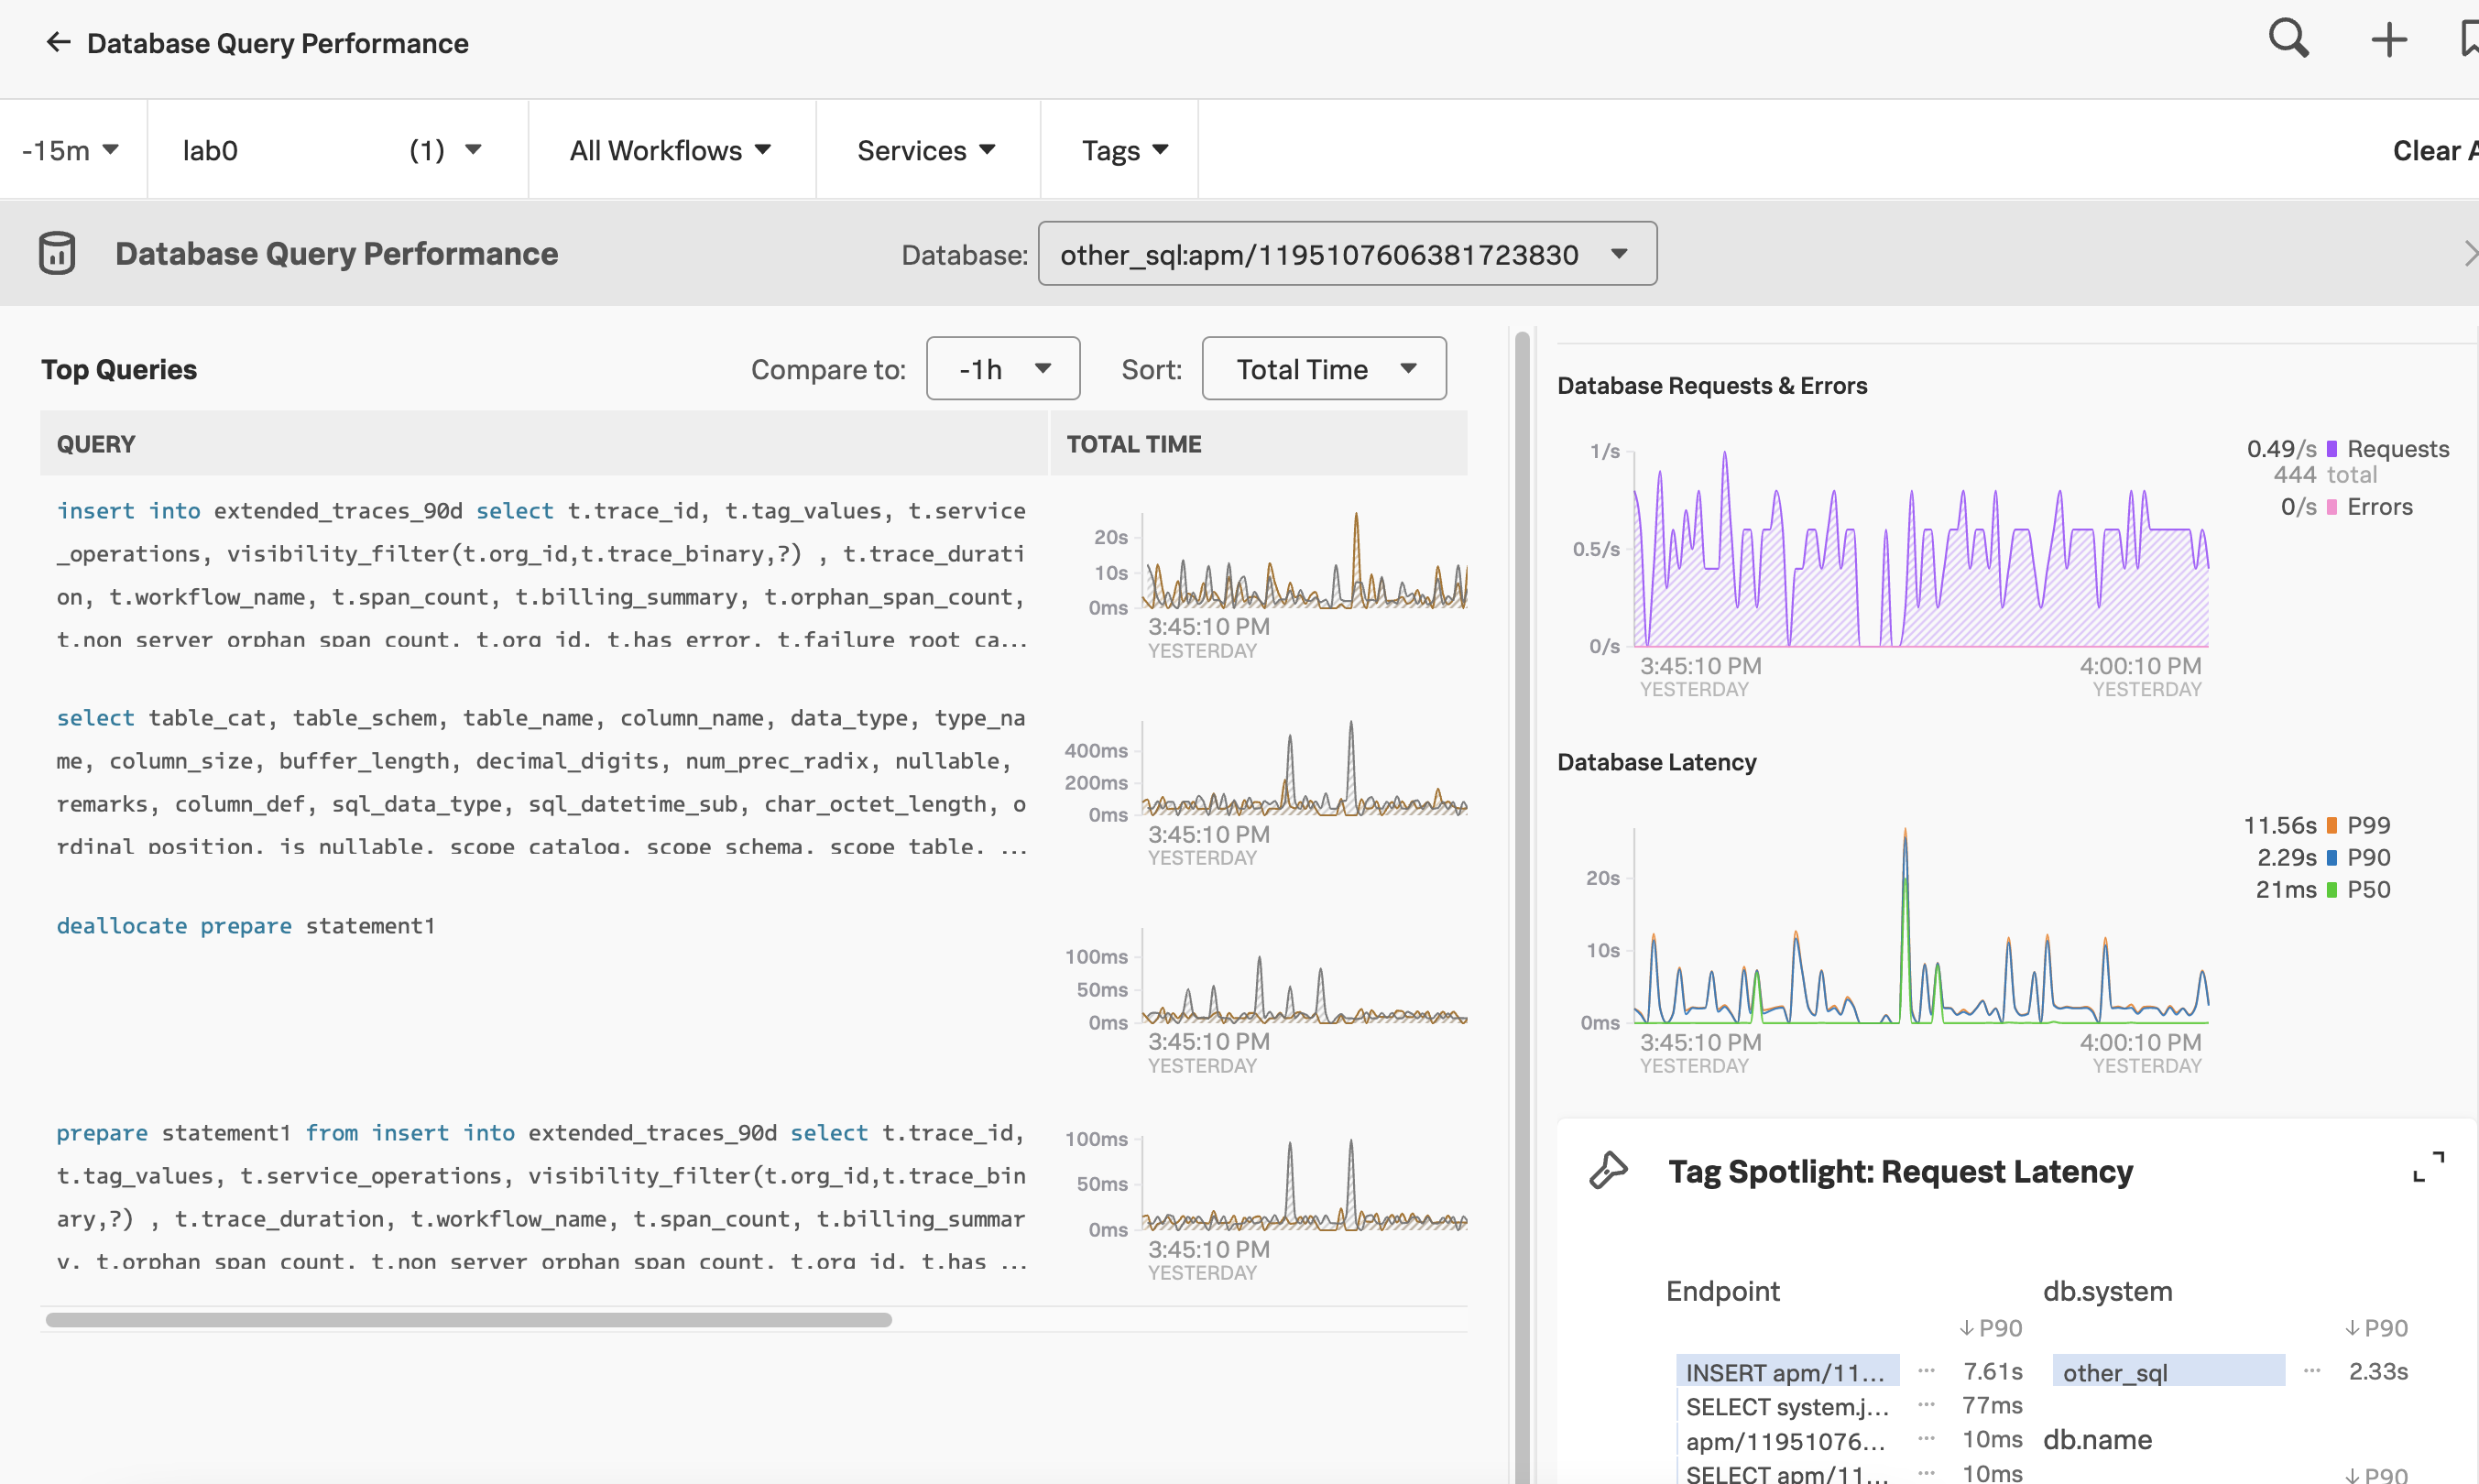
Splunk APMでデータベースクエリのパフォーマンスを確認できます。Splunk Observability Cloudにログインし、左のナビゲーションメニューで APM を選択して、右のパネルで DB クエリパフォーマンス を選択してください。
Splunk Infrastructure Monitoring 🔗
Infrastructure Monitoringは、インフラストラクチャ、アプリケーション、ビジネスメトリクスをリアルタイムで監視するための、業界をリードするカスタムメトリクスプラットフォームです。Splunk Infrastructure Monitoring でナビゲーターを使用する を参照して、パブリッククラウドサービス、コンテナ、ホストなど、ご利用のデプロイのさまざまなレイヤーを探究してください。
Infrastructure Monitoringのヒートマップには、各ホスト、コンテナ、パブリッククラウドサービスのCPU、メモリ、ディスク、ネットワークのメトリクスがリアルタイムストリーミング方式で表示されます。ヒートマップ上でCPU使用率で並べ替えたり、異常値検出 を選択したりして、CPU使用率の急上昇や、ユーザーのロード時間や保存時間の遅延の原因となっているリソースを確認できます。
次のGIFは、あるインシデント対応者がInfrastructure Monitoringで「クリティカル」のアラートを選択している様子を示しています。この対応者は、ホストのCPU使用率がSplunk Observability Cloudの管理者によって設定された想定基準から外れていることを発見します。インシデントに対応するチームは、この情報を使用して、ホストの問題を修正したり、リソースのバランスを再調整して、ユーザーが予想以上の待ち時間を経験することを防止できます。
Infrastructure Monitoringナビゲーターを使用してパブリッククラウド、コンテナ、またはホストを監視する方法は、Splunk Infrastructure Monitoring でサービスとホストを監視する を参照してください。
Splunk Log Observer Connect 🔗
Log Observer Connectを使用して、解決までの平均時間を最短にしながらインシデントの根本原因を掘り下げます。Splunkのコアプラットフォームユーザーであれば、すでに強力なロギングツールを利用できますが、Log Observer Connectは、クエリ言語を知らなくても誰でも使用できる、直感的でコードレスなアプリ内検索ツールを提供します。さらに、Log Observer ConnectはSplunk Observability Cloudへのログのインポートを必要としません。ログはご利用のSplunk Cloud PlatformまたはSplunk Enterpriseのインスタンスに安全な状態で残り、お客様はこれらのログをSplunk Observability Cloudから観察し、Splunkプラットフォームのログをメトリクス、トレース、ユーザーエクスペリエンスと相関付けて、根本原因となる問題をより迅速に掘り下げることができます。
Log Observer Connectを使用すると、ログを集計して、関心対象のフィールド別にグループ化できます。また、フィールドによるログのフィルタリング、個別のログの詳細の表示、フィールドエイリアスの作成を行って、インシデントの根本原因を掘り下げることができます。詳細については、次のページを参照してください:
関連コンテンツを表示するには、関連コンテンツ バーで、関連するインフラストラクチャリソース、メトリクス、またはトレースを選択します。詳細は、Splunk Observability Cloudの関連コンテンツ を参照してください。Splunk Observability Cloudでメトリクスやトレースと相関付けられたログデータを確認することで、チームは問題をより迅速に特定し解決することができます。
次のGIFは、あるインシデント対応者がLog Observer Connectでエラーログを選択し、関連コンテンツを選択して、問題のあるホストを表示するところを示しています。これでユーザーは、問題のあるホストが自動的に選択されたInfrastructure Monitoringのサービスマップに移動できます。サービスマップパネルには、サービスリクエストとエラー、選択したホストのサービスと依存関係のレイテンシが表示されます。
Log Observer Connectでログをクエリする を参照して、Log Observer Connectのクエリでインシデントの根本原因を掘り下げるすべての方法を学習してください。
Real User Monitoring(RUM) 🔗
RUMは、ユーザーセッションを分析することで、ご利用のアプリケーションUIのユーザーエクスペリエンスを監視します。RUMでは、フロントエンドのJavaScriptエラーやネットワークエラーの監視と掘り下げができます。
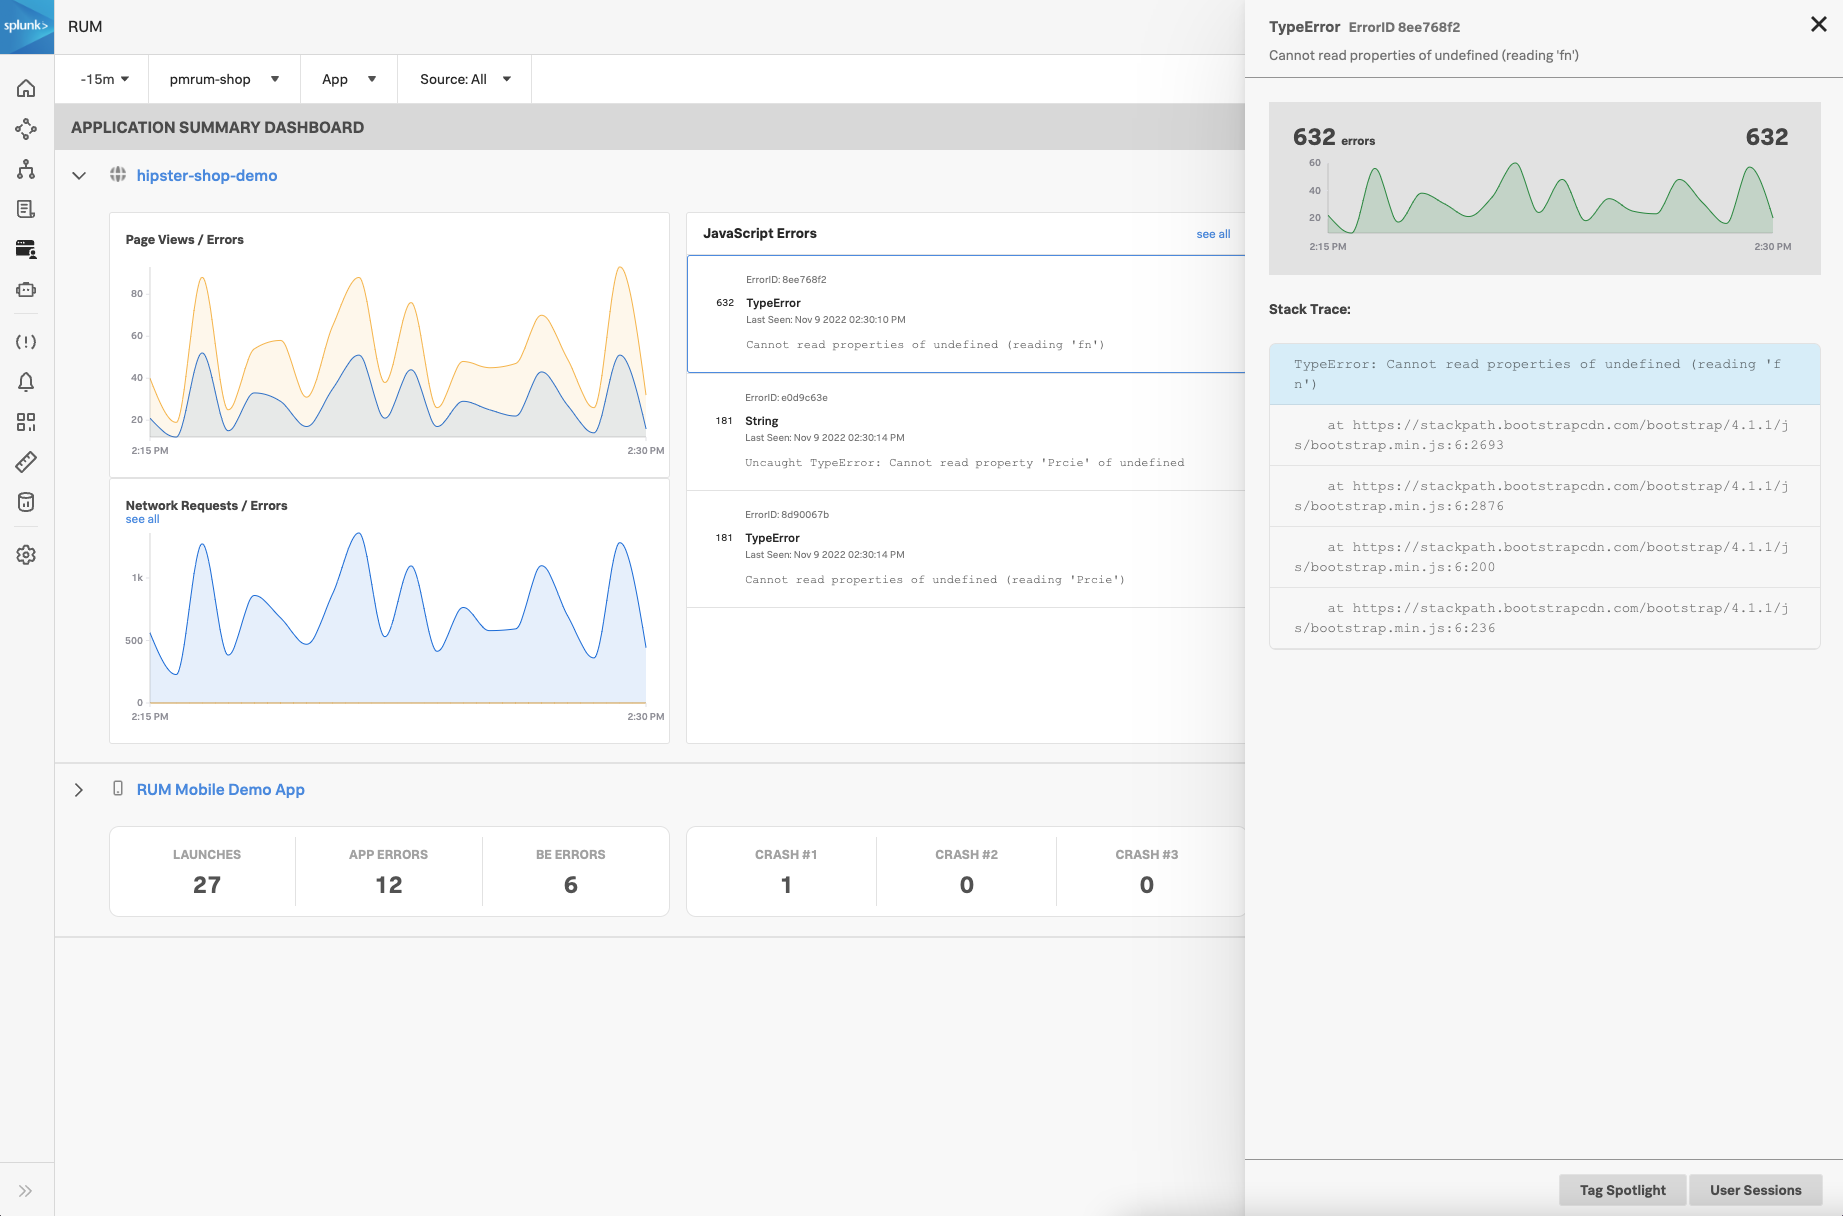
フロントエンドとバックエンドのエラーを探したり、リソースのエラーやリソースの応答時間を確認したりすることができます。ブラウザスパンでエラーを特定する を参照して、JavaScriptエラー、バックエンドエラー、応答時間の遅延を見つける方法を説明したシナリオを確認してください。
RUMは、ユーザーから報告されたエラーの根本的な原因を調査する際に特に役立ちます。詳しくは シナリオ:Kai が Splunk RUM for Mobile でユーザーから報告されたエラーの根本原因を見つける を参照してください。