Splunk APMの請求とサブスクリプション使用状況の監視 🔗
注釈
このトピックは、Splunk APMのサブスクリプション使用状況に関する一般的な側面の理解に役立ててください。請求に関する詳細なお問い合わせについては、Splunkアカウントチームまでご連絡ください。
以下の表には、Splunk APMの請求とサブスクリプション使用状況に関する情報を記載しています。これらの情報は、お客様の組織の使用状況をサブスクリプションのプランおよび制限に照らして監視するためにご利用いただけます。
サブスクリプションの使用状況に関する情報 |
場所 |
ドキュメントへのリンク |
|---|---|---|
プランの種類 |
APMのサブスクリプション使用状況ページ |
|
|
APMのサブスクリプション使用状況ページ |
|
ご利用のサブスクリプションプランのサブスクリプション制限 |
APMのサブスクリプション使用状況ページ |
|
ホストサブスクリプションプランの使用状況メトリクス |
詳細な使用状況レポート |
|
TAPM(1分あたりの解析トレース数)サブスクリプションプランの使用状況メトリクス |
詳細な使用状況レポート |
|
ホストとコンテナの診断 |
ホストとコンテナの診断レポート |
|
費用のかかるサービス、最も多く使用されているタグ値、最も多く取り込まれたトレース |
トレースとスパンの統計 |
|
スロットリングと制限のメトリクス |
APMスロットリングダッシュボード |
|
サブスクリプション使用状況メトリクスの履歴データ |
APMエンタイトルメントダッシュボード |
前提条件 🔗
APMのサブスクリプション使用状況ページを表示するには、adminまたはusageロールが必要です。
APMのサブスクリプション使用状況を確認する 🔗
APMのサブスクリプション使用状況を確認するには、以下の手順に従います:
Splunk Observability Cloudで、Settings に移動し、次に組織のサブスクリプションに応じて Subscription Usage または Billing and Usage に移動します。
APM タブを選択します。
平均使用量パネルを選択すると、1分ごとのデータが表示されます。
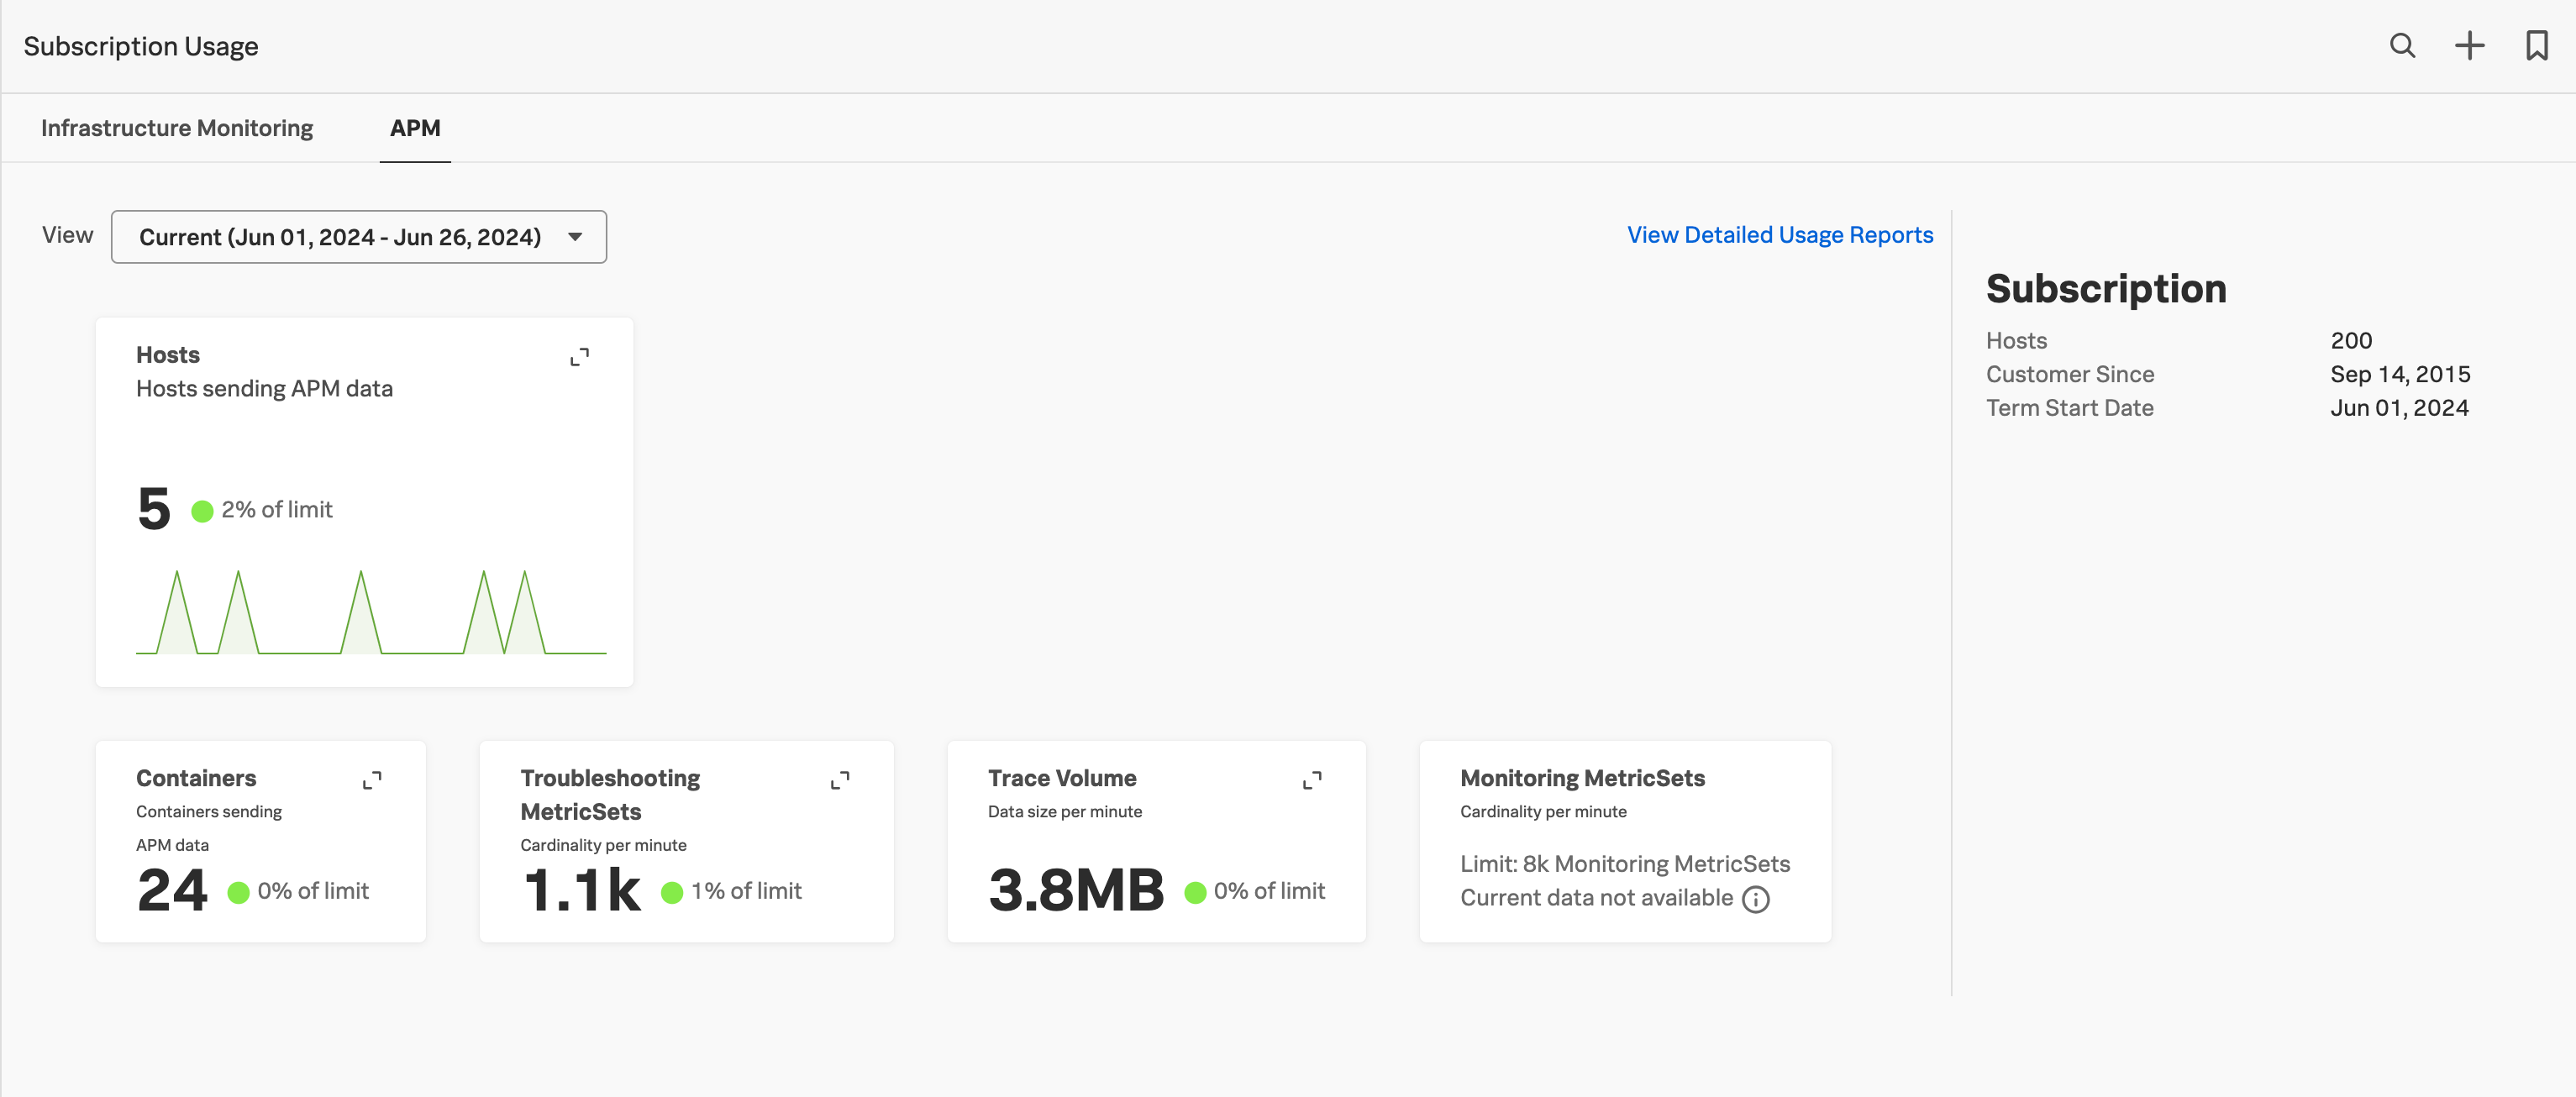
サブスクリプション使用状況ページでは、組織の使用状況に関する以下の情報が表示されます:
プランの種類
- Splunk APMの以下の側面の平均使用量と制限の割合。平均値は、毎月の請求値でもあります。
ホストサブスクリプションプランのホスト数
ホストサブスクリプションプランのコンテナ数
Troubleshooting MetricSets
トレース量
Monitoring MetricSets
サブスクリプションプランのサブスクリプション制限。パネルを選択すると、サブスクリプション制限に関する情報にアクセスできます。
注釈
APMのサブスクリプション使用状況ページには、Monitoring MetricSets(MMS)のパネルが表示されますが、サブスクリプションの使用状況ページでは、チャートの動力となるメトリクスは使用できません。View Detailed Usage Reports を選択すると、現在のヒストグラムMMSデータが表示されます。詳細な使用状況レポートに関する詳しい情報は、詳細な使用状況レポートをダウンロードする を参照してください。
サブスクリプションの使用状況に関するお問い合わせは、技術サポートまたは営業担当者までご連絡ください。
以下の画像は、ホストサブスクリプションプランの場合のAPMのサブスクリプション使用状況ページを示しています。
詳細な使用状況レポートをダウンロードする 🔗
最近の使用期間の詳細な使用状況レポートをダウンロードして、使用状況をより良く把握します。APMの使用状況レポートは、タブ区切りのテキストファイルで利用可能です。このレポートには、使用期間全体のメトリクスとサブスクリプションの使用状況が含まれます。以下の手順に従って、使用状況レポートを表示およびダウンロードしてください:
Splunk Observability Cloudで、組織のサブスクリプションに応じて、 Settings、Subscription Usage または Settings、Billing and Usage の順に移動します。
APM タブを選択します。
View Detailed Usage Reports を選択します。
分析したい使用期間の使用状況レポートを選択します。使用状況レポートが新しいタブで開きます。
レポートをダウンロードするには、使用状況レポートを選択し、.txtファイルとして保存してください。
ホストサブスクリプションプランの使用状況レポートのメトリクス 🔗
ホストサブスクリプションプランの使用状況レポートには、組織の使用状況に関する以下の情報が含まれます:
請求対象のホスト数。1分ごとのホストのデータが利用可能です。
請求対象のコンテナ数。1分ごとのコンテナのデータが利用可能です。
請求対象のトレース量。1分ごとのトレース量のデータが利用可能です。
請求対象のTroubleshooting MetricSets(TMS)の数。TMSデータは1分ごとに利用可能で、1分の回顧期間があります。
請求対象のMonitoring MetricSets(MMS)の数。MMSデータはヒストグラムMMSでのみ利用可能で、使用状況レポート内でのみ利用できます。MMSのデータは10分間隔で利用可能であり、1時間の回顧期間があります。
平均ホスト数。平均は、完了した月の使用状況レポートでのみ利用可能です。
平均コンテナ数。平均は、完了した月の使用状況レポートでのみ利用可能です。
平均Troubleshooting MetricSets数。平均は、完了した月の使用状況レポートでのみ利用可能です。
平均Monitoring MetricSets数。平均は、完了した月の使用状況レポートでのみ利用可能です。
平均トレース量(バイト単位)。平均は、完了した月の使用状況レポートでのみ利用可能です。
注釈
ホスト数とコンテナ数のサブスクリプション使用状況レポートを生成およびダウンロードする方法は、ホストとコンテナの診断レポートをダウンロードする を参照してください。
TAPM(1分あたりの解析トレース数)サブスクリプションプランの使用状況レポートのメトリクス 🔗
TAPMサブスクリプションプランの使用状況レポートには、組織の使用状況に関する以下の情報が含まれます:
請求対象のTAPM数。1分ごとのTAPMのデータが利用可能です。
請求対象のトレース量。1分ごとのトレース量のデータが利用可能です。
請求対象のTroubleshooting MetricSets(TMS)の数。TMSデータは1分ごとに利用可能で、1分の回顧期間があります。
請求対象のMonitoring MetricSets(MMS)の数。MMSデータはヒストグラムMMSでのみ利用可能で、使用状況レポート内でのみ利用できます。MMSのデータは10分間隔で利用可能であり、1時間の回顧期間があります。
平均TAPM。平均は、完了した月の使用状況レポートでのみ利用可能です。
平均Troubleshooting MetricSets数。平均は、完了した月の使用状況レポートでのみ利用可能です。
平均Monitoring MetricSets数。平均は、完了した月の使用状況レポートでのみ利用可能です。
平均トレース量(バイト単位)。平均は、完了した月の使用状況レポートでのみ利用可能です。
ホストとコンテナの診断レポートをダウンロードする 🔗
ホストサブスクリプションプランでは、特定の1分間においてどのホストとコンテナがAPMデータを送信しているかを示すレポートをダウンロードできます。このレポートを使用して、どのホストとコンテナがサブスクリプションの使用量に寄与しているかを特定します。レポートは、トレースの保存期間内に生成およびダウンロードが可能です。詳細については、Application Performance Monitoring(APM)のデータ保持 を参照してください。
サブスクリプションの使用状況レポートをダウンロードするには、次の手順を実行します:
、 の順に移動します。
APM タブを選択します。
Hosts チャートまたは Containers チャートを展開します。
トレースの保存期間内で、チャート内の1時間を選択します。
その1時間内の特定の1分間を選択します。
トレース保存期間内の1分間を選択した場合、Download Data がアクティブになり、選択した1分間が表示されます。ダウンロードボタンを選択して、.csv ファイルをダウンロードします。
次のGIFは、サブスクリプション使用状況レポートをダウンロードする手順を示しています。
選択した1分間ごとに、Splunk APMにデータを送信したホストやコンテナに関連する属性やタグがレポートに表示されます。観察するホストやコンテナのソースとインストルメンテーションのエージェントのバージョンによって、AWSUniqueId、container_id、gcp_id のように、異なるタグが表示される場合があります。
注意
Kubernetesのデプロイメントでは、Kubernetes属性プロセッサーが、k8s.pod.name などのデフォルトの属性を抽出します。これらの属性は、正確なサブスクリプション使用状況を示すために必要です。設定からKubernetes属性プロセッサーを削除しないでください。詳細は、Kubernetes属性プロセッサー を参照してください。
トレースとスパンの統計を使用して、使用量の増加を把握する 🔗
ページ下部の Usage Analyzer を使用して 、使用状況データ内の増加を把握することができます。特に、使用量アナライザーは、最も費用のかかるサービス、最も多く使用されているタグ値、最も多く取り込まれたトレースの特定に役立ちます。
Spans per minute と Trace volume のチャートは、過去8日間の2時間間隔のスパンとトレースの取り込み量を示します。いずれかのチャートで2時間のバーを選択すると、2時間の間隔内の中間点の1分について、Services by span count、Tags by total size、Traces with most spans のデータテーブルが表示されます。
このデータを使用してトラブルシューティングを行い、APM使用量データにおける突然の増加を緩和するための計画を作成します。
APMのスロットリングとエンタイトルメントのダッシュボードを使用して、使用状況をよりよく理解する 🔗
Dashboards を選択します。
「APMエンタイトルメント」または「APMスロットリング」で検索して、APM entitlements と APM throttling のダッシュボードにアクセスし、使用状況をさらに詳しく調査します。
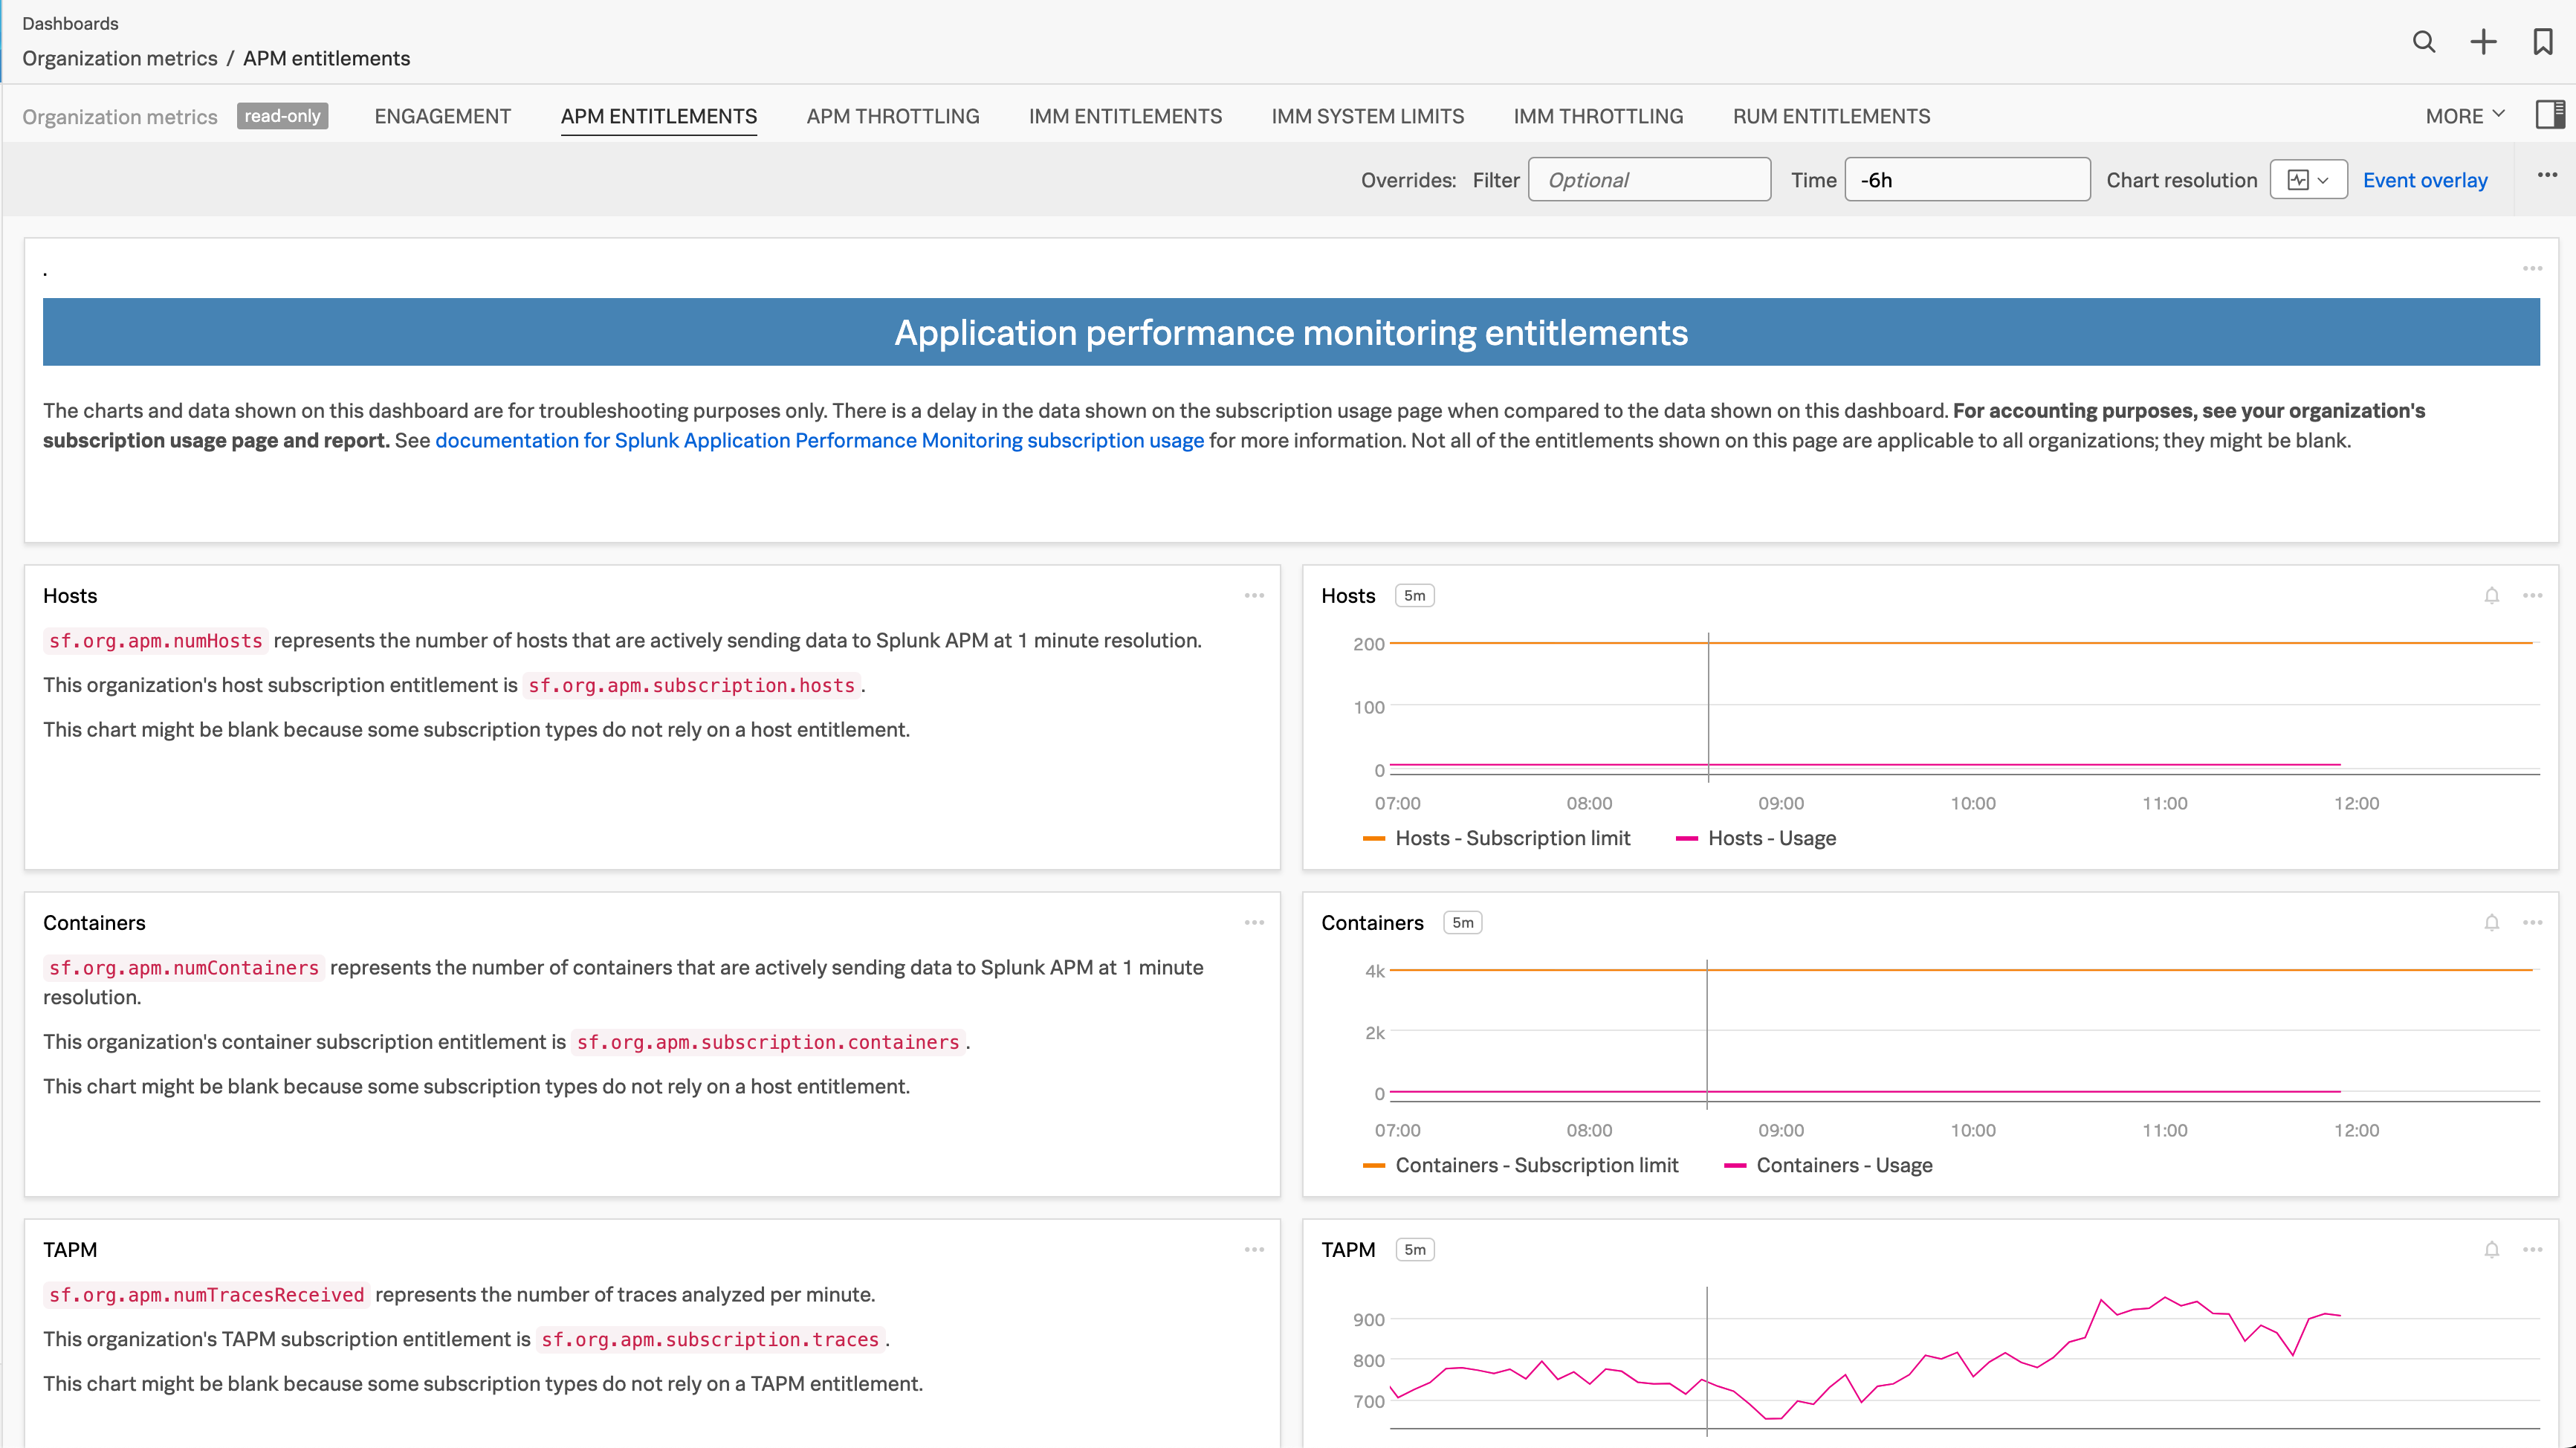
APMエンタイトルメントダッシュボードは、Subscription Usage ページで使用されているメトリクスの履歴データを提供します。
次の画像は、APMエンタイトルメントダッシュボードを示しています。
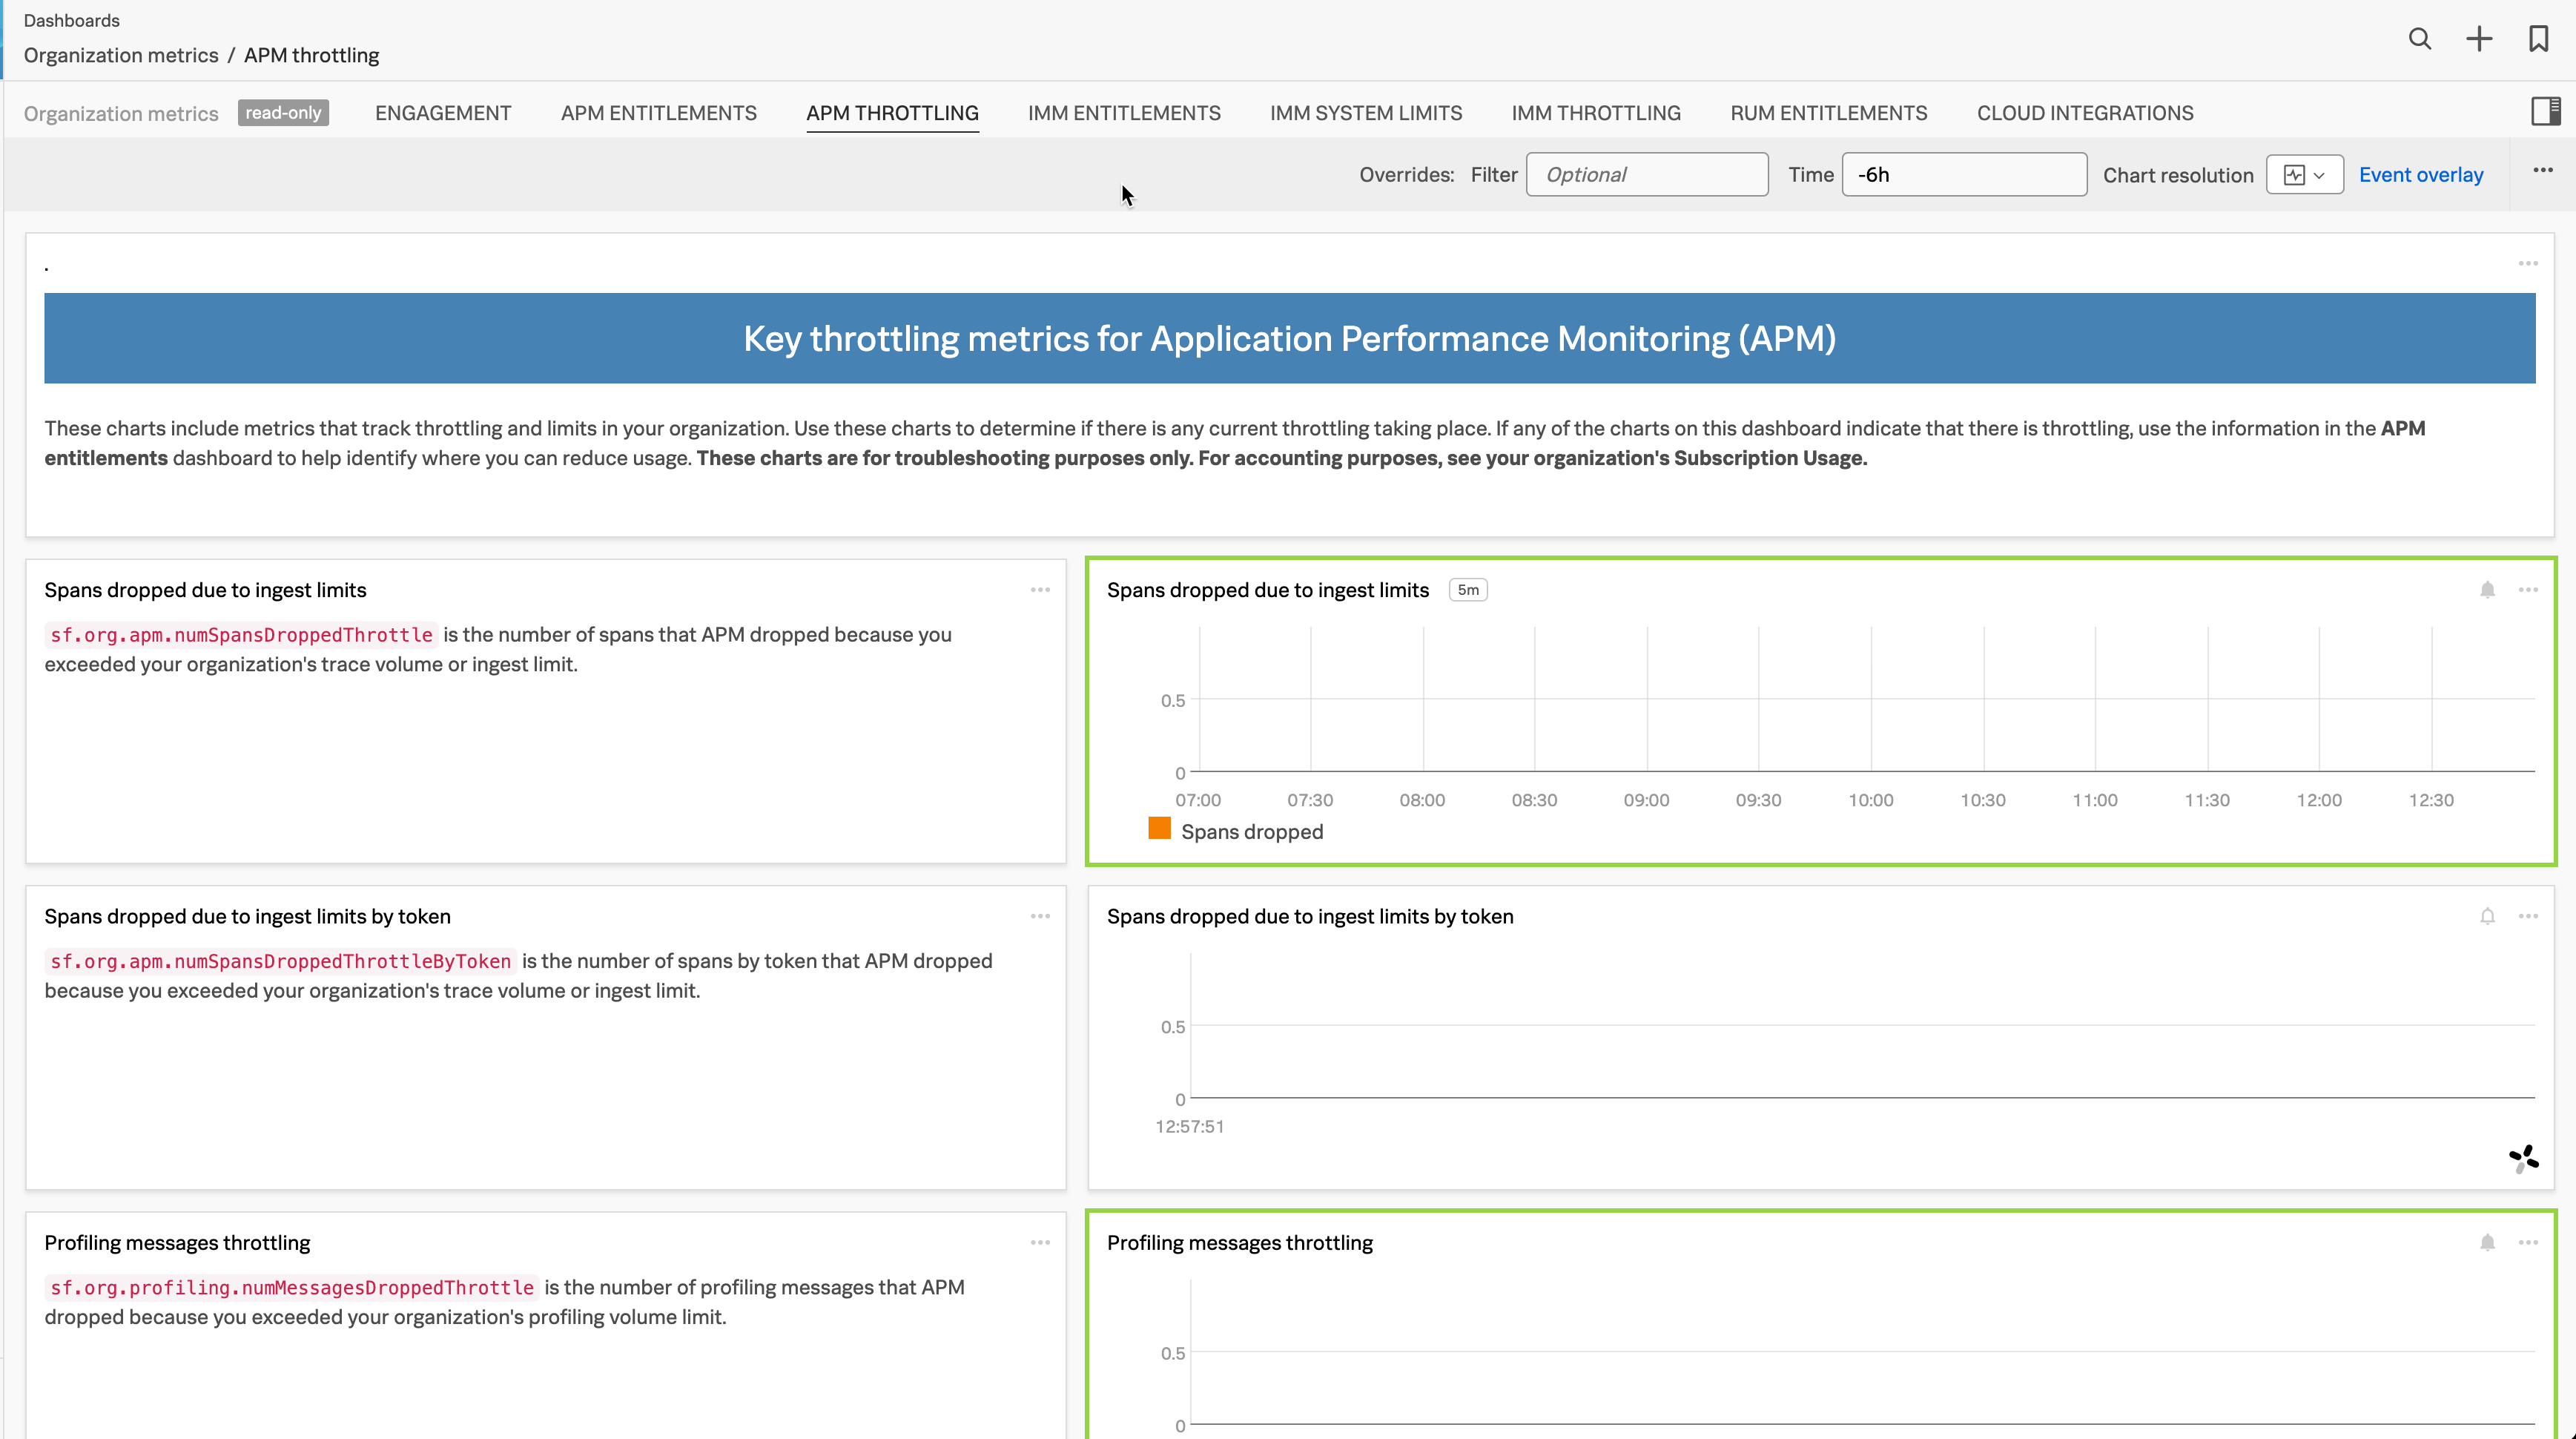
APMスロットリングダッシュボードには、組織でのスロットリングと制限を追跡するメトリクスが含まれています。APMスロットリングダッシュボードのいくつかのメトリクスには、組織のメトリクスがスロットルされているときにアラートを送信するディテクターが設定されています。
次の画像は、APMスロットリングダッシュボードを示しています。
APMによる使用状況の計算方法 🔗
APMは、Splunk Observability Cloudのメトリクスを使用して、TAPM(1分あたりの解析トレース数)サブスクリプションプランおよびホストサブスクリプションプランの使用状況を計算します。ホストサブスクリプションプランの制限は、APMにデータを送信するホストとコンテナの数に基づきます。TAPMサブスクリプションプランの制限は、1分間にAPMに送信するトレースの数に基づきます。
APMは、サブスクリプションの使用期間ごとに、システムが収集する各使用状況メトリクスの値を提供します。これらのメトリクスがプロットされたAPMの「サブスクリプション使用状況」ページのチャートを使用して、各メトリクスの請求対象値を監視することができます。
APMによる各サブスクリプションプランタイプの使用状況の計算方法の詳細については、以下のセクションを参照してください。組織のプランを確認するには、「サブスクリプション使用状況」ページの Subscription パネルを表示します。
以下のセクションでは、TAPMサブスクリプションプランとホストサブスクリプションプランのそれぞれのメトリクスについて詳しく説明します。
TAPMサブスクリプションプランのメトリクス 🔗
以下は、TAPMサブスクリプションプランのAPMサブスクリプション使用状況ページに表示されるチャートの動力となるメトリクスです。
メトリクス |
チャート |
説明 |
|---|---|---|
|
TAPM |
Splunk APMが受信して処理するトレースの数。 |
|
トレース容量 |
Splunk APMが、取り込んだスパンデータから、解凍、および無効なスパンとスロットル済みスパンの破棄の後に受け入れるバイト数。 |
|
Troubleshooting MetricSets |
Troubleshooting MetricSetsのカーディナリティ。TMSデータは1分ごとに利用可能で、1分の回顧期間があります。 |
|
Monitoring MetricSets |
Monitoring MetricSetsのカーディナリティ。MMSデータは、ヒストグラムMMSでのみ利用可能です。MMSのデータは10分間隔で利用可能であり、1時間の回顧期間があります。 |
ホストサブスクリプションプランのメトリクス 🔗
以下は、ホストサブスクリプションプランのAPMサブスクリプション使用状況ページに表示されるチャートの動力となるメトリクスです。
メトリクス |
チャート |
説明 |
|---|---|---|
|
ホスト数 |
Splunk APMにアクティブにデータを送信しているホストの数。 |
|
コンテナ数 |
Splunk APMにアクティブにデータを送信しているコンテナの数。 |
|
トレース容量 |
Splunk APMが、取り込んだスパンデータから、解凍、および無効なスパンとスロットル済みスパンの破棄の後に受け入れるバイト数。 |
|
Troubleshooting MetricSets |
Troubleshooting MetricSetsのカーディナリティ。TMSデータは1分ごとに利用可能で、1分の回顧期間があります。 |
|
Monitoring MetricSets |
Monitoring MetricSetsのカーディナリティ。MMSデータは、ヒストグラムMMSでのみ利用可能です。MMSのデータは10分間隔で利用可能であり、1時間の回顧期間があります。 |
APMのすべての組織メトリクスを確認するには、Splunk Observability Cloudの組織のメトリクスを表示する を参照してください。