サービスビューを使用してサービスの健全性の全体像を把握する 🔗
サービスオーナーは、Splunk APMのサービスビューを使用することで、単一の画面でサービスの健全性の全体像を把握できます。サービスビューには、選択したサービスの可用性、依存関係、RED(リクエスト、エラー、期間)メトリクス、ランタイムメトリクス、インフラストラクチャメトリクス、Tag Spotlight、エンドポイント、およびログのサービスレベル指標(SLI)が含まれます。また、サービスビューからは、サービスのコードプロファイリングとメモリプロファイリングにすばやく移動できます。
サービスビューは、インストルメント済みのサービス、pub/subキュー、 データベース、推定サービスについて利用可能です。様々なサービスタイプで利用可能な情報の詳細については、サービスビューによる様々なサービスタイプのサポート を参照してください。
サービスのサービスビューにアクセスする 🔗
特定のサービスのサービスビューには、いくつかの場所からアクセスできます。
サービスの検索は、上部ツールバーの検索を使用して実行できます。
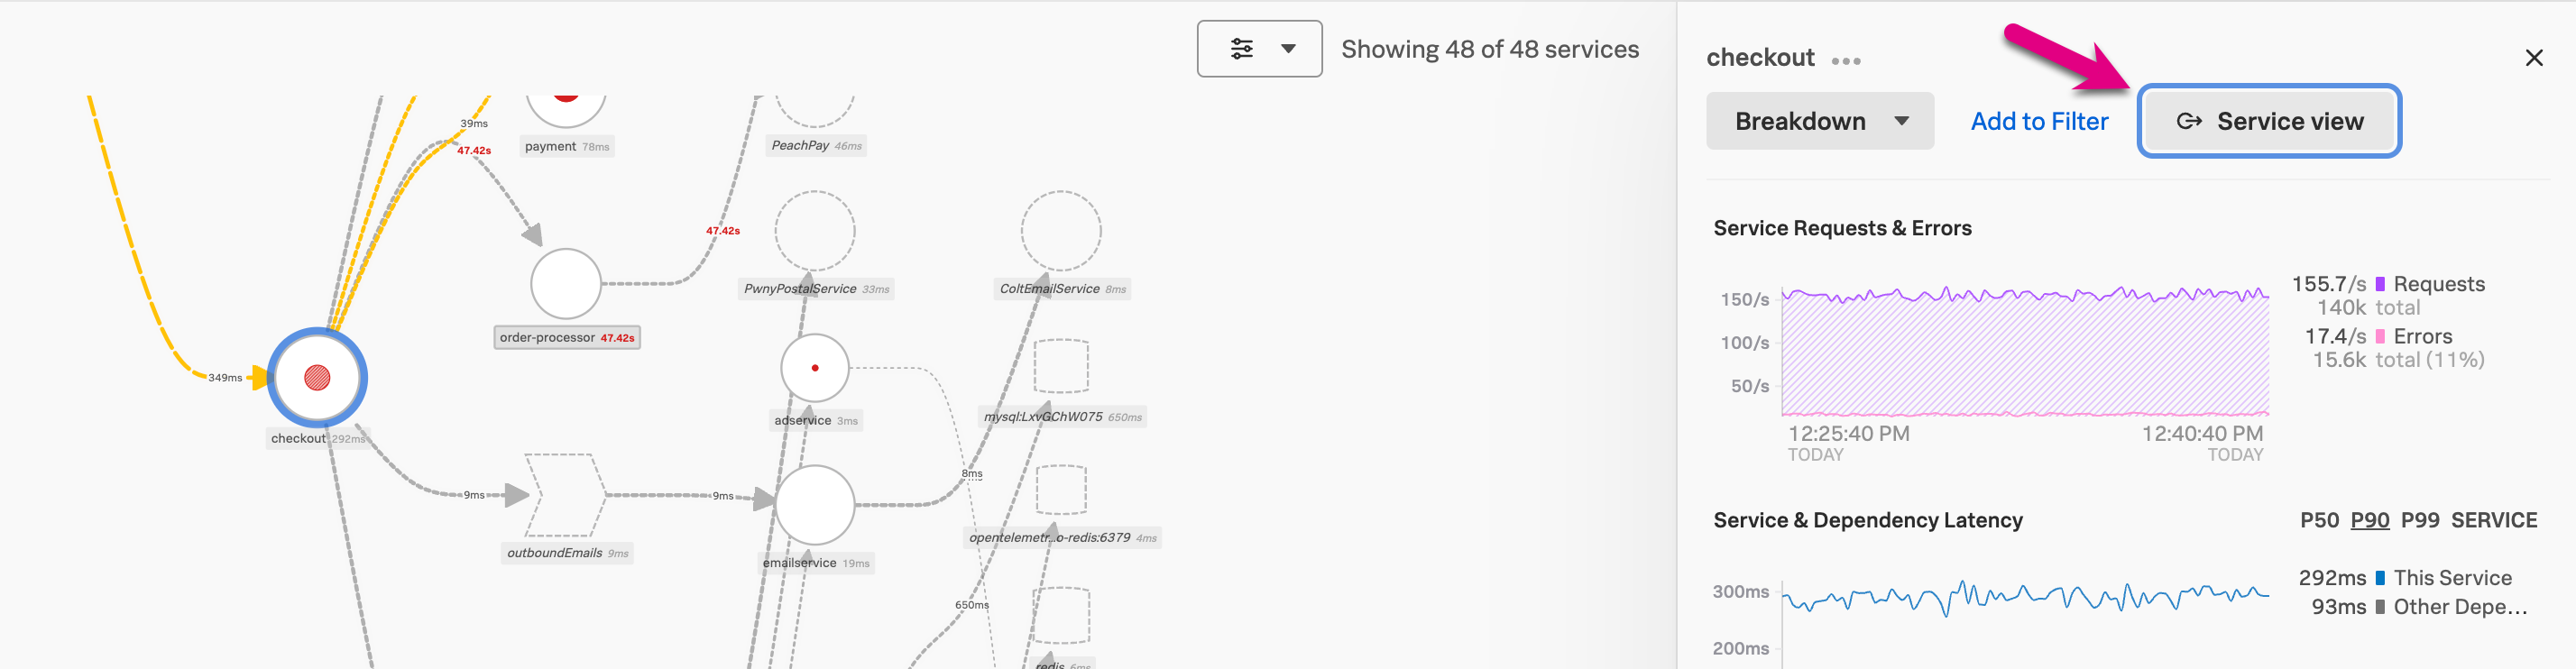
サービスマップ内で特定のサービスのサービスビューにアクセスすることもできます。最初にAPMのランディングページで Service Map を選択します。サービスマップ内でサービスを選択し、パネルで Service view を選択します。
最後に、APMのランディングページからサービスを選択することで、特定のサービスのサービスビューにアクセスすることもできます。
サービスビューを使用して、サービスの健全性を監視する 🔗
サービスビューを開くと、最近閲覧した環境に基づいて環境が選択されます。必要に応じて、環境と時間範囲のフィルターを調整してください。以下のセクションを使用して、サービスの健全性を監視してください。
サービスメトリクス 🔗
Service metrics セクションで以下のメトリクスを使用して、サービスの健全性を監視します。関連性のないサブセクションは折り畳んで、サービスビューをカスタマイズします。
成功率SLI - 成功率のサービスレベル指標(SLI)は、過去30日間でサービスに対するリクエストが成功した時間の割合を示します。このチャートには、成功したリクエストと失敗したリクエストが表示されます。成功率のサービスレベル目標(SLO)を設定している場合は、追加のチャートに、目標で指定したコンプライアンスウィンドウの期間における成功率が表示されます。サービスレベル目標(SLO)を用いて、サービスの健全性メトリクスを測定および追跡します。 を参照してください。
サービスマップ - サービスマップには、表示中のサービスの直接の上流および下流の依存関係が表示されます。サービスビュー内のサービスマップでは、リクエスト数が多い順の20サービスまでに表示が制限されています。チャートにカーソルを合わせ、View full service map を選択すると、サービスマップに移動します。
サービスリクエスト - サービスリクエストチャートには、サービスのリクエストのストリーミングデータが表示されます。サービスリクエストのディテクターが設定されている場合は、チャートの下に、トリガーされたアラートが表示されます。チャートを選択すると、トレースの例が表示されます。アラートの詳細を表示するには、アラートアイコンを選択します。
サービスレイテンシ - サービスレイテンシチャートには、サービスのp50、p90、およびp99のレイテンシデータが表示されます。サービスレイテンシのディテクターが設定されている場合は、チャートの下に、トリガーされたアラートが表示されます。チャートを選択すると、トレースの例が表示されます。アラートの詳細を表示するには、アラートアイコンを選択します。
サービスエラー - サービスエラーチャートには、サービスのエラーのストリーミングデータが表示されます。サービスエラー率のディテクターが設定されている場合は、チャートの下に、トリガーされたアラートが表示されます。チャートを選択すると、トレースの例が表示されます。アラートの詳細を表示するには、アラートアイコンを選択します。
- タイプ別の依存関係レイテンシ - タイプ別の依存関係レイテンシチャートには、各下流システムのレイテンシが表示されます。チャートを選択すると、各システムカテゴリの詳細が表示されます。システムは以下のように分類されます:
サービス - インストルメント済みのサービス
データベース
推定サービス - 未インストルメントのサードパーティのサービス
pub/subキュー - パブリッシャー/サブスクライバーキュー
エラーの内訳 🔗
以下のセクションを使用して、サービスエラーのトラブルシューティングを行い、特定のエラータイプに関連するトレースを表示します。グラフ上のポイントを選択すると、特定のデータポイントのトレース例が表示され、任意の値を選択すると、その値の時系列が非表示になります。
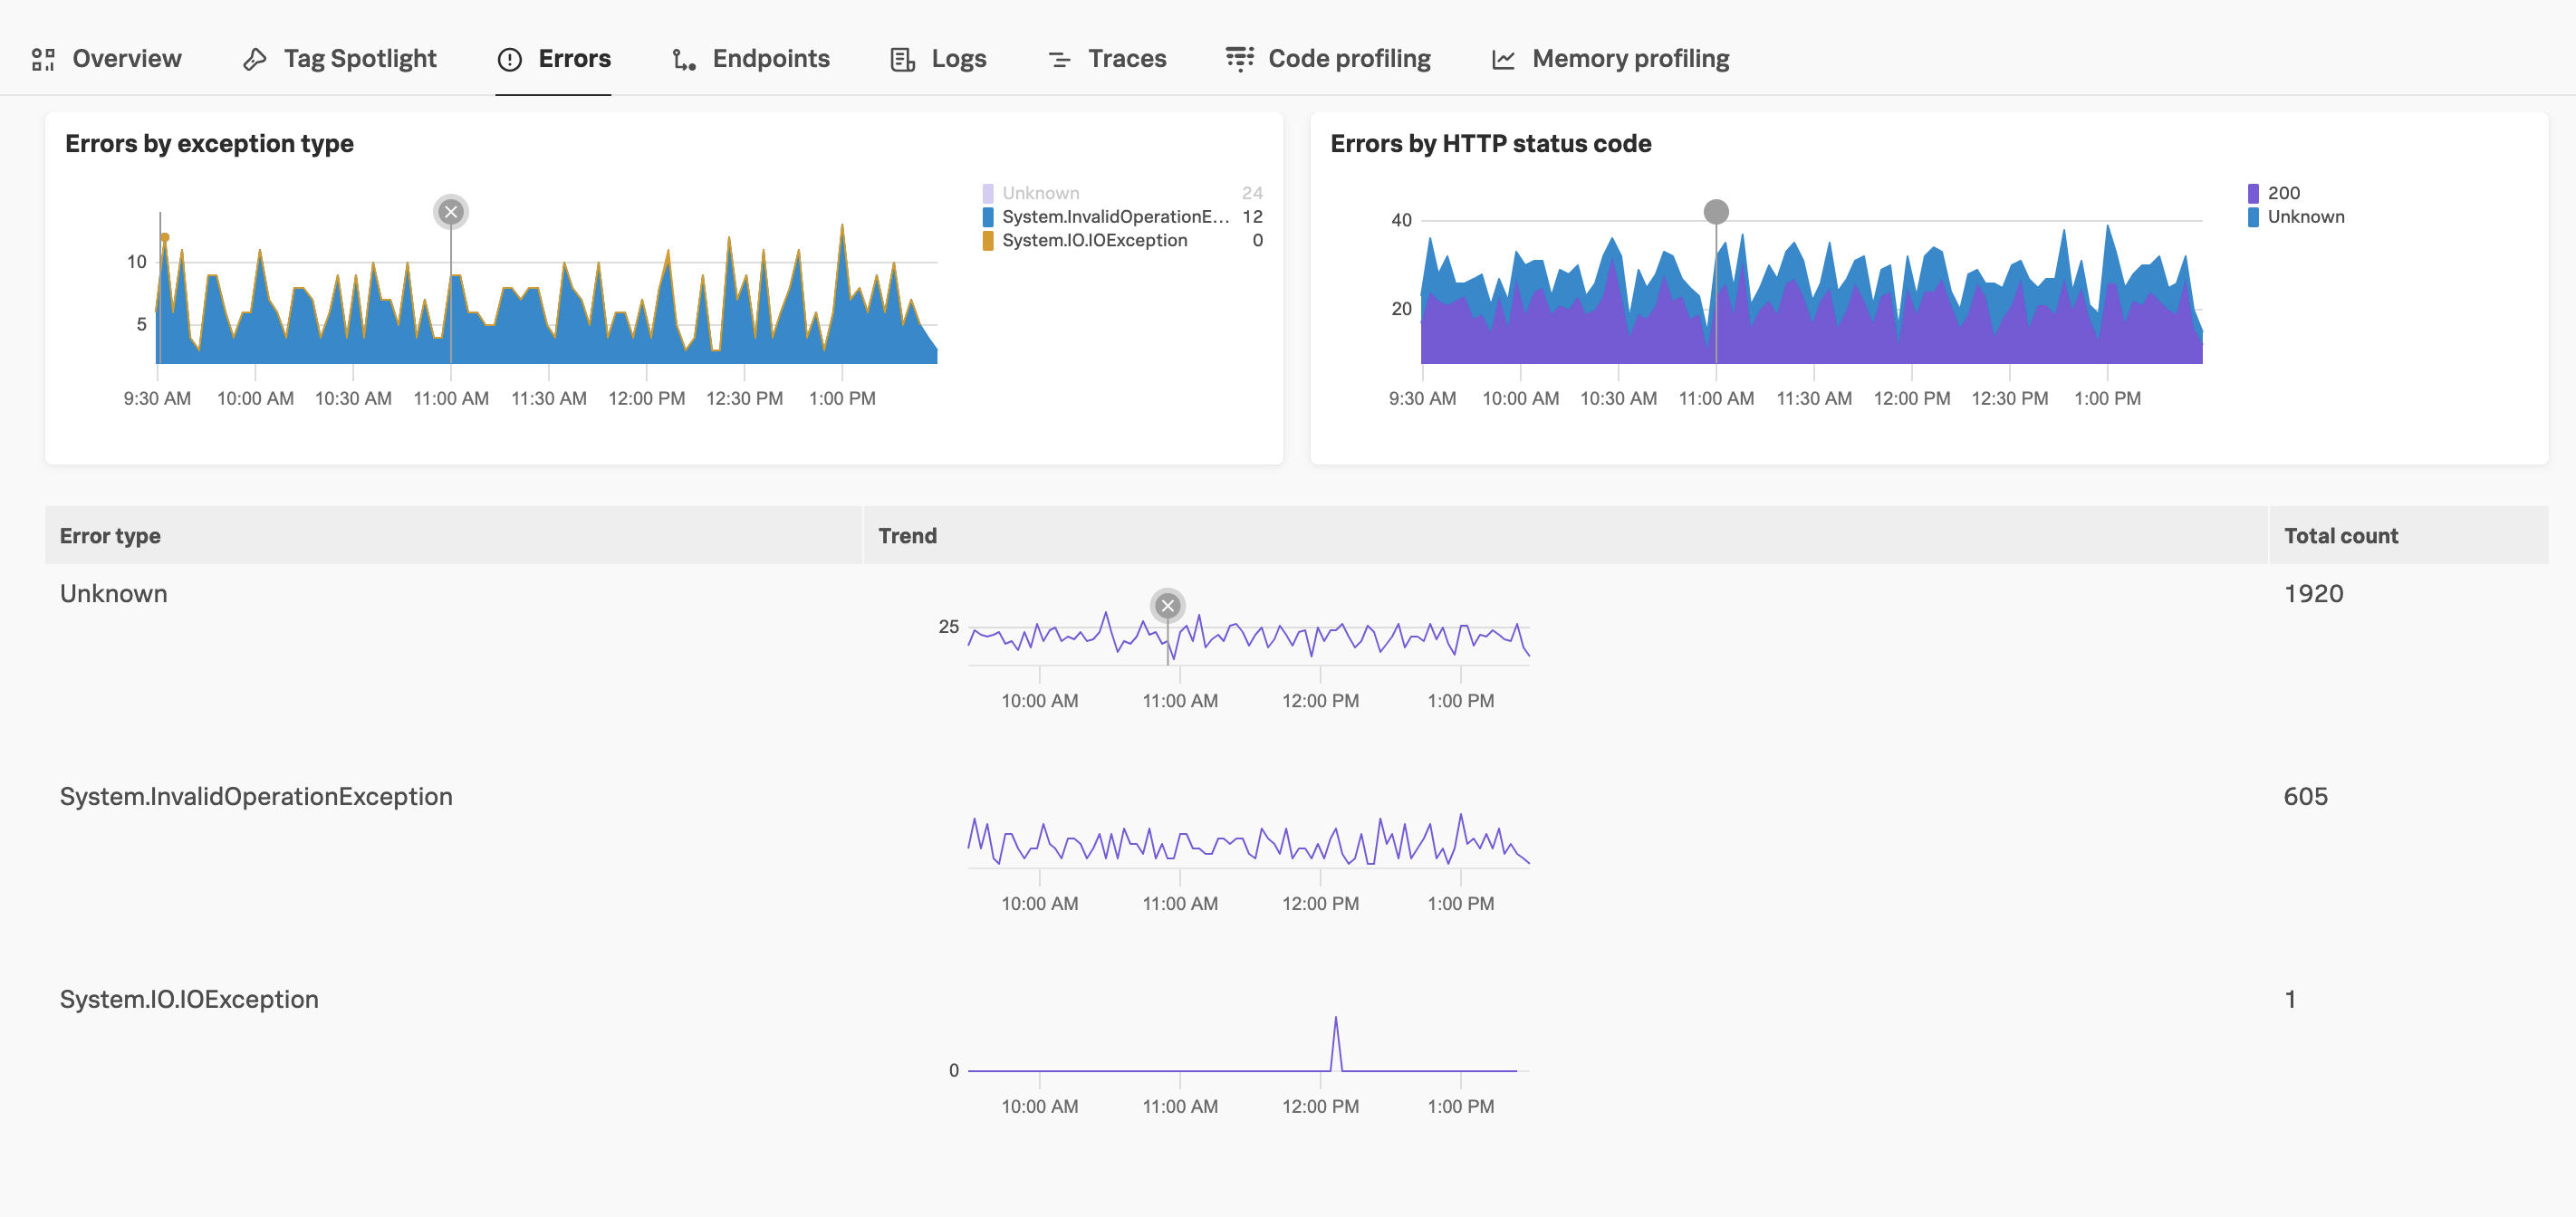
例外タイプ別エラー - スパン属性
exception.typeを持つエラーを表示します。チャート上のデータポイントを選択すると、その期間の関連するトレースとアラートの詳細が表示されます。ステータスコード別エラー - HTTPまたはgRPCエラーのステータスコードに基づいてエラーを表示します。チャートのデータポイントを選択すると、選択した期間とエラーに関連するトレースとアラートの詳細が表示されます。エラーのステータスコードの詳細については、HTTPスパンの意味上の規約 を参照してください。
ランタイムメトリクス 🔗
バックエンドアプリケーションをインストルメントして、Splunk APMにスパンを送信し、ランタイムメトリクスを表示します。バックエンドアプリケーションをインストルメンテーションして、スパンを Splunk APM に送信する を参照してください。
利用可能なランタイムメトリクスは使用言語によって異なります。詳細は、メトリクスのリファレンス を参照してください。
インフラストラクチャメトリクス 🔗
Splunk Distribution of the OpenTelemetry CollectorとSignalFx Exporterを使用している場合、閲覧中の環境およびサービスのインフラストラクチャメトリクスが表示されます。Splunk Distribution of the OpenTelemetry Collector の利用開始 および SignalFx エクスポーター を参照してください。
以下のインフラストラクチャ メトリクスが利用できます:
ホストのCPU使用率
ホストのメモリ使用量
ホストのディスク使用量
ホストのネットワーク使用量
ポッドのCPU使用率
ポッドのメモリ使用量
ポッドのディスク使用量
ポッドのネットワーク使用量
サービスのTag Spotlightビューを表示する 🔗
Tag Spotlight を選択して、サービス用にフィルタリングされたTag Spotlightビューを表示します。Tag Spotlightの詳細については、Tag Spotlightを使用してサービスパフォーマンスを分析する を参照してください。
サービスのエラーを表示する 🔗
Errors タブを選択し、サービスのエラーを可視化します。特定のエラータイプを選択して、そのエラーの利用可能なトレースを表示し、exception.message または exception.stacktrace などの詳細を表示してトラブルシューティングを行います。
管理者は、APM MetricSets ページの Sources of Errors MetricSets セクションに移動し、Pause Indexing を選択することで、これらのメトリッ クを一時停止できます。これらのメトリクスはデフォルトでオンになっています。
サービスのエンドポイントを表示する 🔗
Endpoints タブを選択して、サービスのエンドポイントを表示します。特定のエンドポイントを検索するには、検索フィールドを使用します。並べ替え]ドロップダウンリストを使用して、エンドポイントのソーティング方法を変更します。エンドポイントを選択してエンドポイントの詳細を表示するか、エンドポイントのTag Spotlight、トレース、コード プロファイリング、またはダッシュボードに移動します。
サービスのログを表示する 🔗
Logs を選択すると、閲覧中の環境およびサービスのログが表示されます。デフォルトでは、最初にリストされているLog Observer Connect接続に対応するすべてのインデックスに関するログが表示されます。ログは、 service.name の値を使用して、表示中のサービスでフィルタリングされます。ログに service.name の値がない場合は、Splunk Webでエイリアスを作成できます。Splunk Web でフィールドエイリアスを作成する を参照してください。
別の接続を選択したり、ログの取得元のインデックスを絞り込んだりする場合は、Configure service view を選択します。
Log Observer Connect Index ドロップダウンリストで、Log Observer Connectの接続を選択し、ログの取得元とするインデックスを選択します。
Apply を選択します。
Save changes を選択します。
選択した接続とインデックスは、サービスと環境の一意の組み合わせごとに、組織内のすべてのユーザーに対して保存されます。
サービスのトレースを表示する 🔗
表示中の環境とサービスのトレースを表示するには、Traces を選択します。Traces タブには、Service requests and errors と Service latency のチャートが含まれます。チャート内で選択すると、トレース例が表示されます。
チャートの下には、Traces with errors と Long traces のリストがあります。トレースIDのリンクを選択すると、トレースウォーターフォールビューが開きます。その他のトレースを検索するには、View more in Trace Analyzer を選択します。Trace Analyzerを使用したトレース検索の詳細については、Splunk APMのTrace Analyzerを使用してトレースを調査する を参照してください。
データベースのトップコマンドやトップクエリを表示する 🔗
サービスのドロップダウンメニューからRedisまたはSQLデータベースを選択した場合、Database Query Performance を選択すると、データベースのトップコマンドまたはトップクエリを表示できます。詳細は Database Query Performanceの監視 を参照してください。
サービスのコードプロファイリングビューに移動する 🔗
Code profiling を選択して、サービス用にフィルタリングされたAlwaysOn Profilingのコードプロファイリングビューに移動します。AlwaysOn Profilingの詳細については、Splunk APMのAlwaysOn Profilingの概要 を参照してください。
サービスのメモリプロファイリングビューに移動する 🔗
Memory profiling を選択して、サービス用にフィルタリングされたAlwaysOn Profilingのメモリプロファイリングビューに移動します。AlwaysOn Profilingの詳細については、Splunk APMのAlwaysOn Profilingの概要 を参照してください。
サービスビューの設定 🔗
Configure service view を選択して、サービスに関して表示するLog Observer Connectの接続およびインデックスを変更します。
Log Observer Connect Index ドロップダウンリストで、Log Observer Connectの接続を選択し、ログの取得元とするインデックスを選択します。
Apply を選択します。
Save changes を選択します。
選択した接続とインデックスは、サービスと環境の一意の組み合わせごとに、組織内のすべてのユーザーに対して保存されます。
サービスビューによる様々なサービスタイプのサポート 🔗
サービスビューで利用できる情報は、選択したサービスタイプによって異なります。次の表は、各サービスタイプで利用可能なセクションを示しています。
サービスビューのセクション |
インストルメント済みサービス |
データベース |
pub/subキュー |
推定サービス |
|---|---|---|---|---|
概要 |
サポートあり。サービスメトリクス、ランタイムメトリクス、インフラストラクチャメトリクスを含みます |
サポートあり。サービスメトリクスのみを含みます |
サポートあり。サービスメトリクスのみを含みます |
サポートあり。サービスメトリクスのみを含みます |
Tag Spotlight |
あり |
あり |
あり |
あり |
エンドポイント |
あり |
なし |
なし |
あり |
ログ |
あり |
あり |
あり |
あり |
トレース |
あり |
あり |
あり |
あり |
Database Query Performance |
なし |
サポートあり。RedisとSQLデータベースについてのみ表示されます。 |
なし |
なし |
コードプロファイリング |
あり |
なし |
なし |
なし |
メモリプロファイリング |
あり |
なし |
なし |
なし |
メトリクスのリファレンス 🔗
サービスビューでは以下のメトリクスが使用されます。
サービスメトリクス 🔗
チャート |
メトリクス |
|---|---|
サービスリクエスト |
|
サービスレイテンシ |
|
サービスエラー |
|
SLI/SLO |
|
.NETランタイムメトリクス 🔗
チャート |
メトリクス |
|---|---|
ヒープ使用量 |
|
GCコレクション |
|
アプリケーションアクティビティ |
|
GCヒープサイズ |
|
GC一時停止時間 |
|
モニターのロック競合 |
|
スレッドプールのスレッド |
|
例外 |
|
Javaランタイムメトリクス 🔗
チャート |
メトリクス |
|---|---|
メモリ使用量 |
|
割当率 |
|
クラスローディング |
|
GCアクティビティ |
|
GCオーバーヘッド |
|
スレッドカウント |
|
スレッドプール |
|
Node.jsランタイムメトリクス 🔗
チャート |
メトリクス |
|---|---|
ヒープ使用量 |
|
常駐セットサイズ |
|
GCアクティビティ |
|
イベントループラグ |
|
インフラストラクチャメトリクス 🔗
チャート |
メトリクス |
|---|---|
ホストのCPU使用率 |
|
ホストのメモリ使用量 |
|
ホストのディスク使用量 |
|
ホストのネットワーク使用量 |
|
ポッドのCPU使用率 |
|
ポッドのメモリ使用量 |
|
ポッドのディスク使用量 |
|
ポッドのネットワーク使用量 |
|