Docs » Splunk APMでスパンタグとMetricSetsを使ってサービスを分析する » Tag Spotlightを使用してサービスパフォーマンスを分析する

Tag Spotlightを使用してサービスパフォーマンスを分析する 🔗

Splunk Observability CloudでTag Spotlightを使用してサービスのパフォーマンスを分析し、インデックス化したスパンタグを使って高レイテンシや高エラー率の原因となっている傾向を発見します。スパンタグのインデックス化の詳細な手順については、Index span tags to create Troubleshooting MetricSets を参照してください。

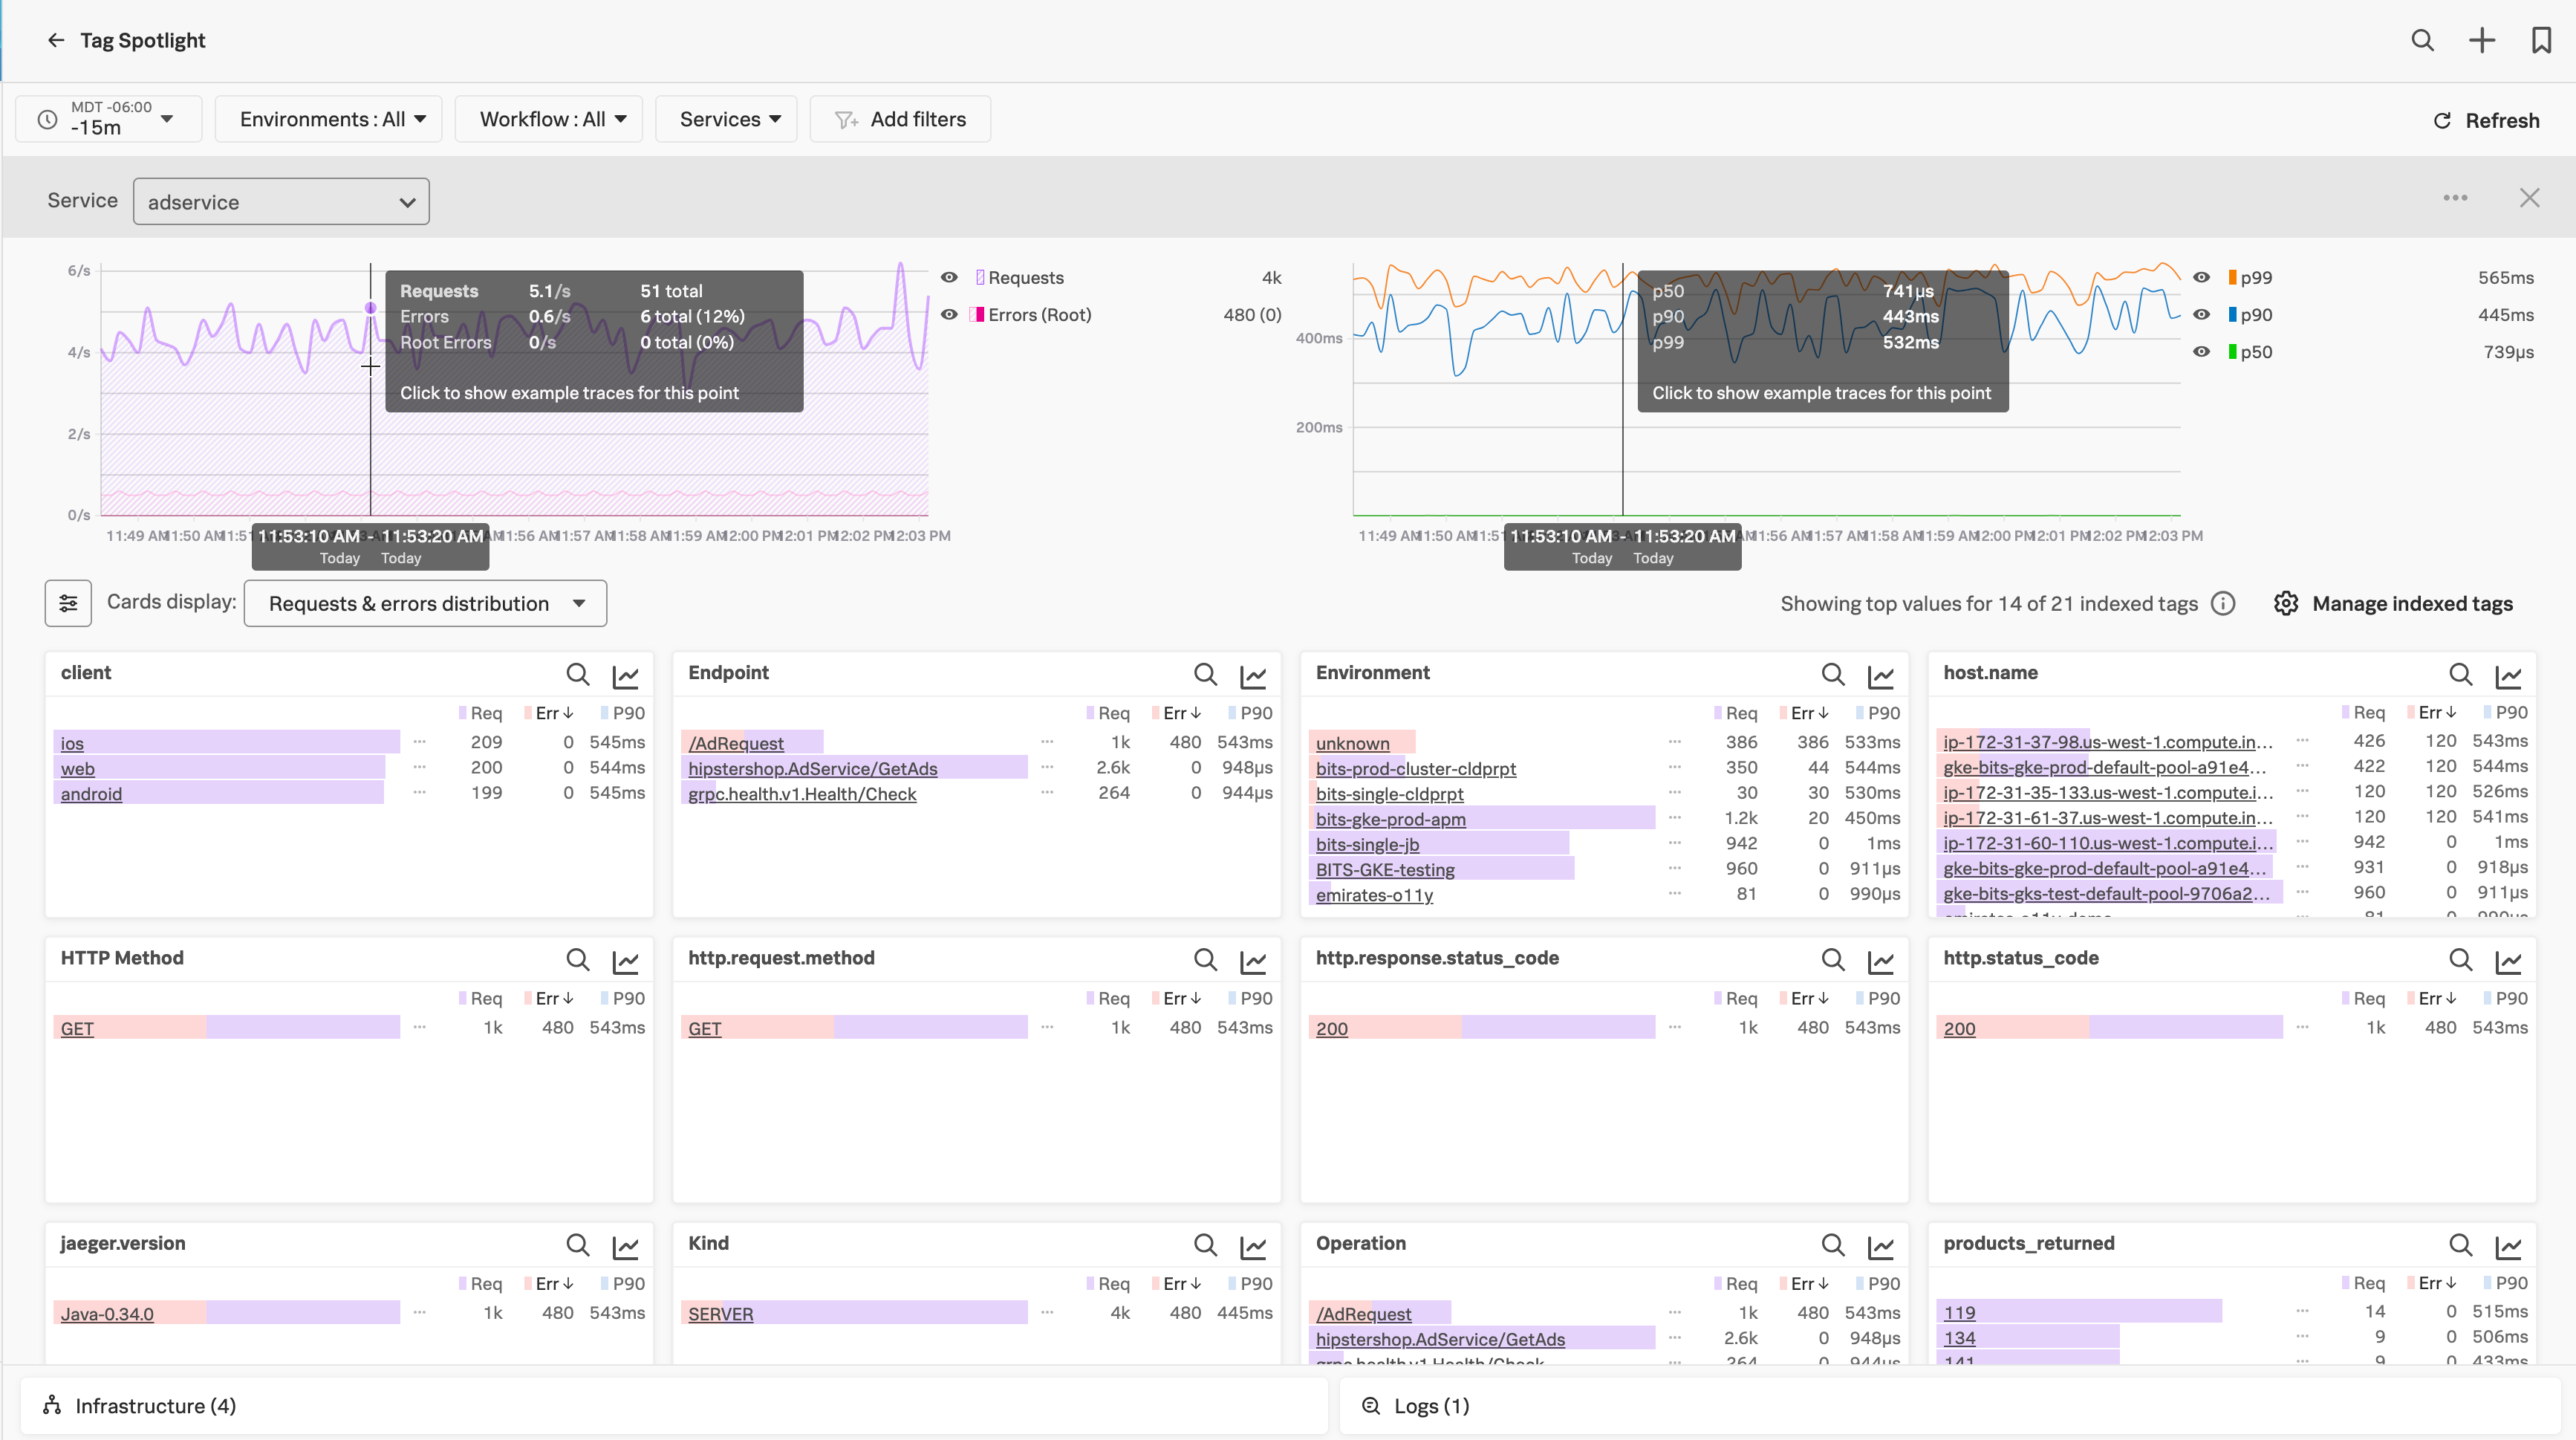
For every service, Tag Spotlight provides time-series charts for request, error, and duration (RED) metrics for every value of each indexed span tag. Request and error charts display the total number of requests, errors, and root cause errors, and duration charts display p50, p90, and p99 latency. These values are based on Troubleshooting MetricSets (TMS), which Splunk APM generates for every indexed span tag. When you select span tag values or a time range, you can view relevant traces to learn more about outlying incidents.

The following image shows the a chart for requests and errors and a chart for duration for an example frontend service. Under the charts there are bar charts with RED metrics for each indexed span tag.

スパンタグのインデックス化とTroubleshooting MetricSetsの生成の方法については、Index span tags to create Troubleshooting MetricSets を参照してください。APMにおけるMetricSetsの概要については、APMのMetricSetsについて を参照してください。

View service performance by indexed span tags 🔗

To view service performance broken down by your indexed span tags, follow these steps:

  1. Tag Spotlightに移動します。Tag Spotlightには、いくつかの場所からアクセスできます:
    • APMのランディングページまたはサービスマップ内で Tag Spotlight パネルを選択する

    • Select the Tag Spotlight tab in the service view for your service.

    • 上部ツールバーの検索を使用してTag Spotlightを検索し、ナビゲーション結果を選択してTag Spotlightに移動する

  2. Add time range, environment, workflow, service, operation, and tag filters as need to refine the data in your Tag Spotlight view. The default time range is for the last 15 minutes, and the data resolution is 10 seconds.

  3. REDメトリクスの分布を確認するには、上部にあるリクエスト、エラー、およびレイテンシの時系列チャートを使用します。

  4. リクエスト、エラー、およびレイテンシの時系列チャートの下にある棒グラフを使用して、各インデックス済みスパンタグのREDメトリクスを確認します。

  5. インデックス済みのすべてのスパンタグの分布を表示します。タグの棒グラフは、リクエスト数&エラー数の分布またはレイテンシの分布のいずれかを表示します。この棒グラフに表示したいデータを選択するには、Cards display メニューを使用します。

  6. 棒グラフセクションの左上にあるメニューを選択すると、各タグパネルに表示するメトリクスを選択できます。このメニューを使用して、値のないタグの表示/非表示も選択できます。

Customize tags display on Tag Spotlight 🔗

To configure the layout of the cards on the Tag Spotlight page, follow these steps:

  1. From the menu on the top left of the bar chart, select Customize card display order.

  2. Drag each of the span tags to arrange the order that cards are displayed on the page. Arrange the tags by priority, order of importance, or other criteria.

  3. Select Save.

さらに詳しく 🔗

To view a detailed examples using Tag Spotlight, see:

このページは 2024年11月07日 に最終更新されました。