カスタムディメンションを使用してMonitoring MetricSetを生成する 🔗
カスタムディメンションを使用してMonitoring MetricSets(MMS)を作成し、サービスをリアルタイムで監視します。Splunk APMはMMSのデフォルトのセットを提供していますが、インデックス化したスパンタグを使用してカスタムディメンションを作成し、追加のMMSを設定することもできます。カスタムのMMSを使用してカスタムのチャート、ダッシュボード、ディテクターを作成し、チームにとって最も重要なことを追跡できます。カスタムディメンションのチャート、ダッシュボード、アラートの設定 を参照してください。
MetricSetsとは 🔗
MetricSetsは、特定のメトリクスのパフォーマンスを経時的に追跡するために使用できるメトリック時系列(MTS)です。サービスパフォーマンスの分析を支援するために、APMは2つのカテゴリのMetricSetsを提供しています。Troubleshooting MetricSets(TMS)とMonitoring MetricSets(MMS)です。Troubleshooting MetricSetsは高カーディナリティのトラブルシューティングに使用し、Monitoring MetricSetsはリアルタイムの監視およびアラートに使用します。
APMはデフォルトでMetricSetsのコレクションを提供します。また、その他のスパンタグやプロセスをインデックス化することで、追加のTMSを生成したり、インデックス化プロセスの一部としてオプションでカスタムディメンションのMonitoring MetricSets(MMS)を作成したりすることもできます。APMのMetricSetsの種類の概要と、デフォルトで利用可能なMetricSetsのリストについては、APMのMetricSetsについて を参照してください。
このトピックは、スパンタグまたはプロセスをインデックス化してMonitoring MetricSetsを作成する方法の学習用に使用してください。Troubleshooting MetricSetsの作成方法については、スパンタグをインデックス化してTroubleshooting MetricSetsを作成する を参照してください。
前提条件 🔗
カスタムMMSを作成するには、adminロールが必要です。
カスタムMMSを作成するには、MMSのベースにするスパンタグまたはプロセスをインデックス化する必要があります。スパンタグをインデックス化してTroubleshooting MetricSetsを作成する を参照してください。
MetricSetsをよく理解していない場合は、APMのMetricSetsについて を参照してください。
(オプション)MetricSetsの基礎となる概念の概要については、メタデータ:ディメンション、カスタムプロパティ、タグ、属性 を参照してください。
カスタムMonitoring MetricSetsを使用して重要なメトリクスを監視する 🔗
APMがデフォルトで作成するMMSに加えて、カスタムのディメンションを使用して追加のMMSを作成し、version や cloud.provider といった特定のインデックス済みスパンタグまたはプロセスによって、デフォルトで作成されたメトリクスのフィルタリングや集計ができます。
カスタムMMSは、サービスレベルおよびエンドポイント(スパン)レベルで作成できます。サービスレベルMMS用のカスタムディメンションを作成すると、APMは、カスタムディメンションとして選択したインデックス付きスパンタグまたはプロセスを使って、サービスレベルメトリクスを含むMMSを作成します。エンドポイントレベルのメトリクスを追加すると、APMは、カスタムディメンションとして選択したインデックス付きスパンタグまたはプロセスを使って、スパンレベルのメトリクスを含むMMSを作成します。
カスタムディメンションを使ってMMSを作成すると、そのカスタムディメンションを使用して、チャート、ダッシュボード、およびアラートを作成できます。カスタムディメンションのチャート、ダッシュボード、アラートの設定 を参照してください。
カスタムMMSの具体的なシナリオについては、シナリオ:Kaiが、ある顧客グループ向けのサービスのレイテンシのディテクターを監視する を参照してください。
カスタムディメンションを使用してインストルメント済みサービス用のMonitoring MetricSetsを作成する 🔗
MMSを作成する前に、まず以下を検討してください:
MMSを最も効率的にするために、データのカーディナリティをどのように割り当てる必要があるか。
組織のカーディナリティ制限。全体的なカーディナリティを最適化するためのMetricSet構成の編集に関するガイダンスは、Monitoring MetricSetsでのカーディナリティのトラブルシューティング を参照してください。
Monitoring MetricSetsの必要な構成方法を選択する 🔗
Monitoring MetricSetsの作成には、3つの方法があります:
サービスレベルのMMSのみ
特定のサービス内の特定のエンドポイントに対するエンドポイントレベルのMMS
サービス内のすべてのエンドポイントに対して、サービスレベルのMMSとエンドポイントレベルのMMSの両方を適応させる
自分のニーズに最適なオプションを選択して、組織のカーディナリティのエンタイトルメントを効率的に割り当ててください。詳細は「 MMSの効率を上げるための設定 」を参照してください。
また、特定のタグ値でフィルタリングして、MMSのカーディナリティをさらに減らすこともできます。
オプション |
ガイダンス |
|---|---|
サービスレベルMMSとサービス内のすべてのエンドポイントのエンドポイントレベルMMS |
このオプションは、選択した各サービスのカスタムディメンションMMSと、選択した各サービスの各エンドポイントのMMSを作成します。これは最もカーディナリティが高いオプションです。 |
サービスレベルMMSと特定のエンドポイントのエンドポイントレベルMMS |
このオプションは、選択した各サービスのカスタムディメンションMMSと、選択した特定のエンドポイントのMMSを作成します。Endpoint Filters というラベルの付いたボックスの中に、関心のある特定のエンドポイントのリスト、または関心のある特定のエンドポイントのMMSを作成するための正規表現パターンを指定します。これにより、不要なカーディナリティを最小化することができます。 |
サービスレベルのMMSのみ |
このオプションは、選択した各サービスのMMSを作成し、エンドポイントレベルのMMSは作成しません。これは最もカーディナリティが低いオプションです。 |
Monitoring MetricSetsのスコープ 🔗
カスタムMMSは、エンドポイント( span* で始まるメトリクス)に対しても、サービス( service.request.* で始まるメトリクス)に対しても作成できますが、現時点では、ワークフロー( workflow* で始まるメトリクス)またはトレース( trace* で始まるメトリクス)に対しては作成できません。カスタムMMSは、グローバルタグには対応していません。利用可能なデフォルトのMMSのメトリクスとディメンション を参照してください。
Monitoring MetricSetを追加する 🔗
インストルメント済みのサービス用のMonitoring MetricSetsを作成するには、以下の手順に従います:
APM MetricSets ページには、以下のいずれかの方法で移動します:
Splunk APMで、APM Configuration を選択し、メニューから APM MetricSets を選択する。APM MetricSetsページが開きます。
Splunk Observability Cloudの任意の場所から、ナビゲーションバーで Settings を選択し、Data Configuration の下にある APM MetricSets を選択する。
APM MetricSets ページには、2つのオプションがあります:
スパンタグまたはプロセスを既にインデックス化している場合、そのスパンタグはMetricSetsのリストに表示され、既にTroubleshooting MetricSetsを生成しています。そのスパンタグの編集アイコンを選択して、Edit MetricSet ダイアログボックスを開き、以下の手順でMonitoring MetricSetを構成に追加します。
タグまたはプロセスをまだインデックス化していない場合は、新規MetricSet を選択します。インデックス化したいスパンタグまたはプロセスの 名前 を入力します。次に、以下の手順で続行します。
スコープ は、APMがスパンタグやプロセスをトレース内のサービスとどのように関連付けるかを決定します。Service フィールドに、Monitoring MetricSetを作成するサービス(1つまたは複数)を入力します。カスタムディメンションMMSは、サービスレベルのインデックス付きスパンタグに対してのみ作成できます。グローバルにインデックス化されたスパンタグに対してカスタムMMSを作成することはできません。
Add MetricSet または Edit MetricSet ダイアログボックスで、Monitoring MetricSetも作成する のチェックボックスにチェックを入れます。
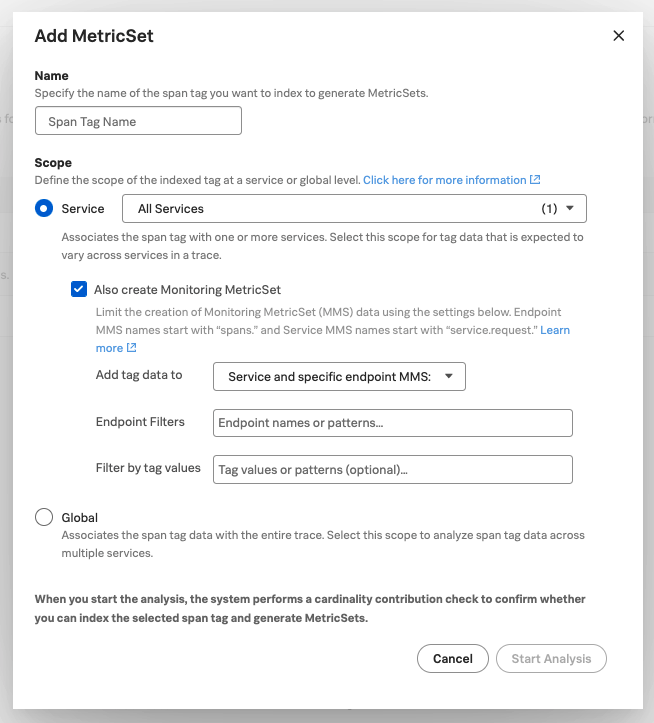
- ドロップダウンから、タグまたはプロセスのデータをMonitoring MetricSetに追加する方法を選択します。詳細は Monitoring MetricSetsの必要な構成方法を選択する を参照してください。
Service and all endpoint MMS: 選択した各サービスのMMSと、選択した各サービスの各エンドポイントのMMSを作成します。
Service and specific endpoint MMS: 選択した各サービスのMMSと、選択した特定のエンドポイントのMMSを作成します。Endpoint Filters を追加するには、エンドポイントのリストまたは正規表現パターンを指定して、関心のある特定のエンドポイントのMMSを作成します。
Service MMS only: 選択した各サービスのMMSを作成し、エンドポイントレベルのMMSは作成しません。
(オプション) Filter by tag values というラベルの付いたフィールドで、タグフィルターを追加して、入力したタグ値に関連するデータのみを含むようにMMSの範囲を絞り込みます。これにより、MetricSetsのカーディナリティをさらに減らすことができます。
分析の開始 を選択して設定を送信します。Splunk APMがスパンタグまたはプロセスの分析を実行し、このMetricSetの潜在的なカーディナリティ寄与度を計算し、それがエンタイトルメントの制限内におさまるどうかを判断します。
作成したMetricSetは、カーディナリティチェックの実行中、テーブル内の「 保留中のMetricSets 」セクションに「 Analyzing 」ステータスで表示されます。チェックの実行には、しばらく時間がかかる場合があります。
注意
MetricSetの保留状態の期限は1時間です。MetricSetをアクティブ化する前にタイムアウトした場合は、分析を再度実行してください。
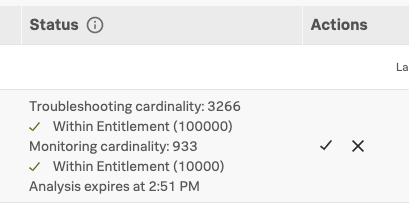
カーディナリティチェックが実行されたら、カーディナリティを確認し、新しいMetricSetをアクティブ化します。
この新しいMetricSetのインデックス化によるカーディナリティへの影響が自分のサブスクリプションの制限内であれば、緑色のチェックマークと「エンタイトルメントの範囲内」(Within Entitlement)という表示が見えます。Actions の下のチェックマークを選択して、Monitoring MetricSetをアクティブ化します。
MetricSetをアクティブ化する前にチェックがタイムアウトした場合は、再度分析を実行してください。
チェックが「失敗」と表示された場合は、カーディナリティがMMSに関するサブスクリプションの制限を超えているか、なんらかの理由で無効になっています。インデックス付きスパンタグおよびプロセスのカーディナリティ寄与度 を参照してください。MetricSetをより効率的に設定する手順や、その他のトラブルシューティング手段については、Monitoring MetricSetsでのカーディナリティのトラブルシューティング を参照してください。
以下は、カーディナリティチェックの例を示すものです。
注釈
標準的なMMSについて、Splunk APMは、MMSの時系列のディメンション名にあるドットをアンダースコアに置き換えます。ヒストグラムのMMSについては、アンダースコアは維持されます。
Create a Monitoring MetricSet for an inferred service 🔗
注釈
MMSでサポートされるのは、サードパーティまたは未インストルメントのHTTPサービスのみです。
推定サービス用のMonitoring MetricSetsを作成するには、以下の手順に従います:
APM MetricSets ページには、以下のいずれかの方法で移動します:
Splunk APMで、APM Configuration を選択し、メニューから APM MetricSets を選択する。APM MetricSetsページが開きます。
Splunk Observability Cloudの任意の場所から、ナビゲーションバーで Settings を選択し、Data Configuration の下にある APM MetricSets を選択する。
APM MetricSets ページで、Inferred Service Monitoring MetricSets セクションまでスクロールし、Add Inferred Service MMS を選択します。
作成するMonitoring MetricSetsの対象としたい推定サービスを選択します。
Save を選択します。
作成したMetricSetは、カーディナリティチェックの実行中、テーブル内の「 保留中のMetricSets 」セクションに「 Analyzing 」ステータスで表示されます。チェックの実行には、しばらく時間がかかる場合があります。
注意
MetricSetの保留状態の期限は1時間です。MetricSetをアクティブ化する前にタイムアウトした場合は、分析を再度実行してください。
カーディナリティチェックが実行されたら、カーディナリティを確認し、新しいMetricSetをアクティブ化します。
この新しいMetricSetのインデックス化によるカーディナリティへの影響が自分のサブスクリプションの制限内であれば、緑色のチェックマークと「エンタイトルメントの範囲内」(Within Entitlement)という表示が見えます。Actions の下のチェックマークを選択して、Monitoring MetricSetをアクティブ化します。
MetricSetをアクティブ化する前にチェックがタイムアウトした場合は、再度分析を実行してください。
チェックが「失敗」と表示された場合は、カーディナリティがMMSに関するサブスクリプションの制限を超えているか、なんらかの理由で無効になっています。インデックス付きスパンタグおよびプロセスのカーディナリティ寄与度 を参照してください。
カスタムディメンションのチャート、ダッシュボード、アラートの設定 🔗
カスタムのMonitoring MetricSetsに基づいて、チャート、ダッシュボード、アラートを作成できます。
作成したカスタムディメンションMonitoring MetricSetsを使用するには、sf_dimensionalized:true フィルターを適用します。これにより、デフォルトのMonitoring MetricSetsによって作成されたメトリクスは除外されます。メトリクスをさらにフィルタリングするには、作成した新しいディメンション(インデックス化したタグ名)を使用します。
タスク |
ドキュメント |
|---|---|
チャートの作成 |
|
ダッシュボードの作成 |
|
アラートの作成 |
|
APMダッシュボードでのサービスの監視 |
Monitoring MetricSetsのメトリクスとディメンション 🔗
各MMSには、サービスパフォーマンスの監視とアラートに使用できる、スパンとトレースのメトリクスとディメンションのセットがあります。
集計でメトリクスが過剰にカウントされるのを防ぐため、Splunk APMの内蔵のダッシュボードとチャートは、カスタムディメンションMMSを自動的に除外します。カスタムディメンンションMMSには、カスタムディメンションMMSを含めるためのマーカーディメンション、sf_dimensionalized: true があります。
ダッシュボードやチャートを作成する際、!sf_dimensionalized: true でフィルターを追加することで、カスタムディメンションMMSを除外することができます。カスタムディメンションMMSの時系列をチャートで見たい場合は、sf_dimensionalized: true でフィルタリングしてから、表示したいカスタムディメンションで集計します。