App とサービスのオートディスカバリー 🔗
Splunk Distribution of the OpenTelemetry Collector は、データソースを自動的に識別し、メトリクスとトレースを収集して Splunk Observability Cloud に送信することができます。オートディスカバリーとゼロコードインストルメンテーションにより、Splunk Distribution of the OpenTelemetry Collector やアプリケーションをデプロイする前に手動で設定する必要はありません。
以下の図は、オートディスカバリーがデータソースを見つける方法を示しています:
オートディスカバリーは、データベースやWebサーバーといったサードパーティのサービスからシグナルデータを検出して収集します。Collectorがオートディスカバリーを介して構成スニペットを自動生成しますが、これを変更して既存の構成に組み込むことにより、サービスのデータを取得することができます。
注意
サードパーティサービス用のオートディスカバリーは、LinuxおよびKubernetes環境にあるCollectorでのみ利用可能です。
オートディスカバリーを使用すると、バックエンドアプリケーションのゼロコードインストルメンテーションを有効にすることもできます。これにより、Collectorは、ソースアプリケーションコードを変更したり、新しいインストールや設定手順を追加したりすることなく、アプリケーションの言語ランタイムからデータを取得できます。このオプションを使用すると、インストルメンテーション・エージェントを個別にインストールおよび構成する必要がなくなります。Collectorのオートディスカバリー機能を使用したゼロコードインストルメンテーションは、Java、Node.js、および.NETの言語ランタイムでのみ使用できます。他の方法として、バックエンドアプリケーションをインストルメンテーションして、スパンを Splunk APM に送信する で説明するように、8つのバックエンド言語に対して、Collectorからは独立してゼロコードインストルメンテーションをデプロイすることもできます。
Supported host services and applications for automatic discovery
サードパーティアプリケーションのオートディスカバリーは、以下のサービスについて、Linux と Kubernetes 環境でサポートされています。
サービス |
レシーバー |
|---|---|
Apache Web Server |
Apache Web Serverレシーバー。Apache Web Serverレシーバー を参照してください。 |
MySQL |
MySQLレシーバー。MySQL レシーバー を参照してください。 |
PostgreSQL |
PostgreSQLレシーバー。PostgreSQLレシーバー を参照してください。 |
OracleDB |
Oracle DBレシーバー。Oracle Databaseレシーバー を参照してください。 |
NGINX |
NGINXレシーバー。NGINXレシーバー を参照してください。 |
RabbitMQ |
RabbitMQレシーバー。RabbitMQレシーバー を参照してください。 |
Redis |
Redisレシーバー。Redis レシーバー を参照してください。 |
MongoDB |
MongoDB レシーバー。MongoDB レシーバー を参照してください |
Kafka |
Kafkaレシーバー。Kafka メトリクスレシーバー を参照してください。 |
Microsoft SQL Server |
Microsoft SQL Serverレシーバー。Microsoft SQL Serverレシーバー を参照してください |
詳細を読む:
Kubernetes: Kubernetes でのサードパーティアプリケーションのオートディスカバリー
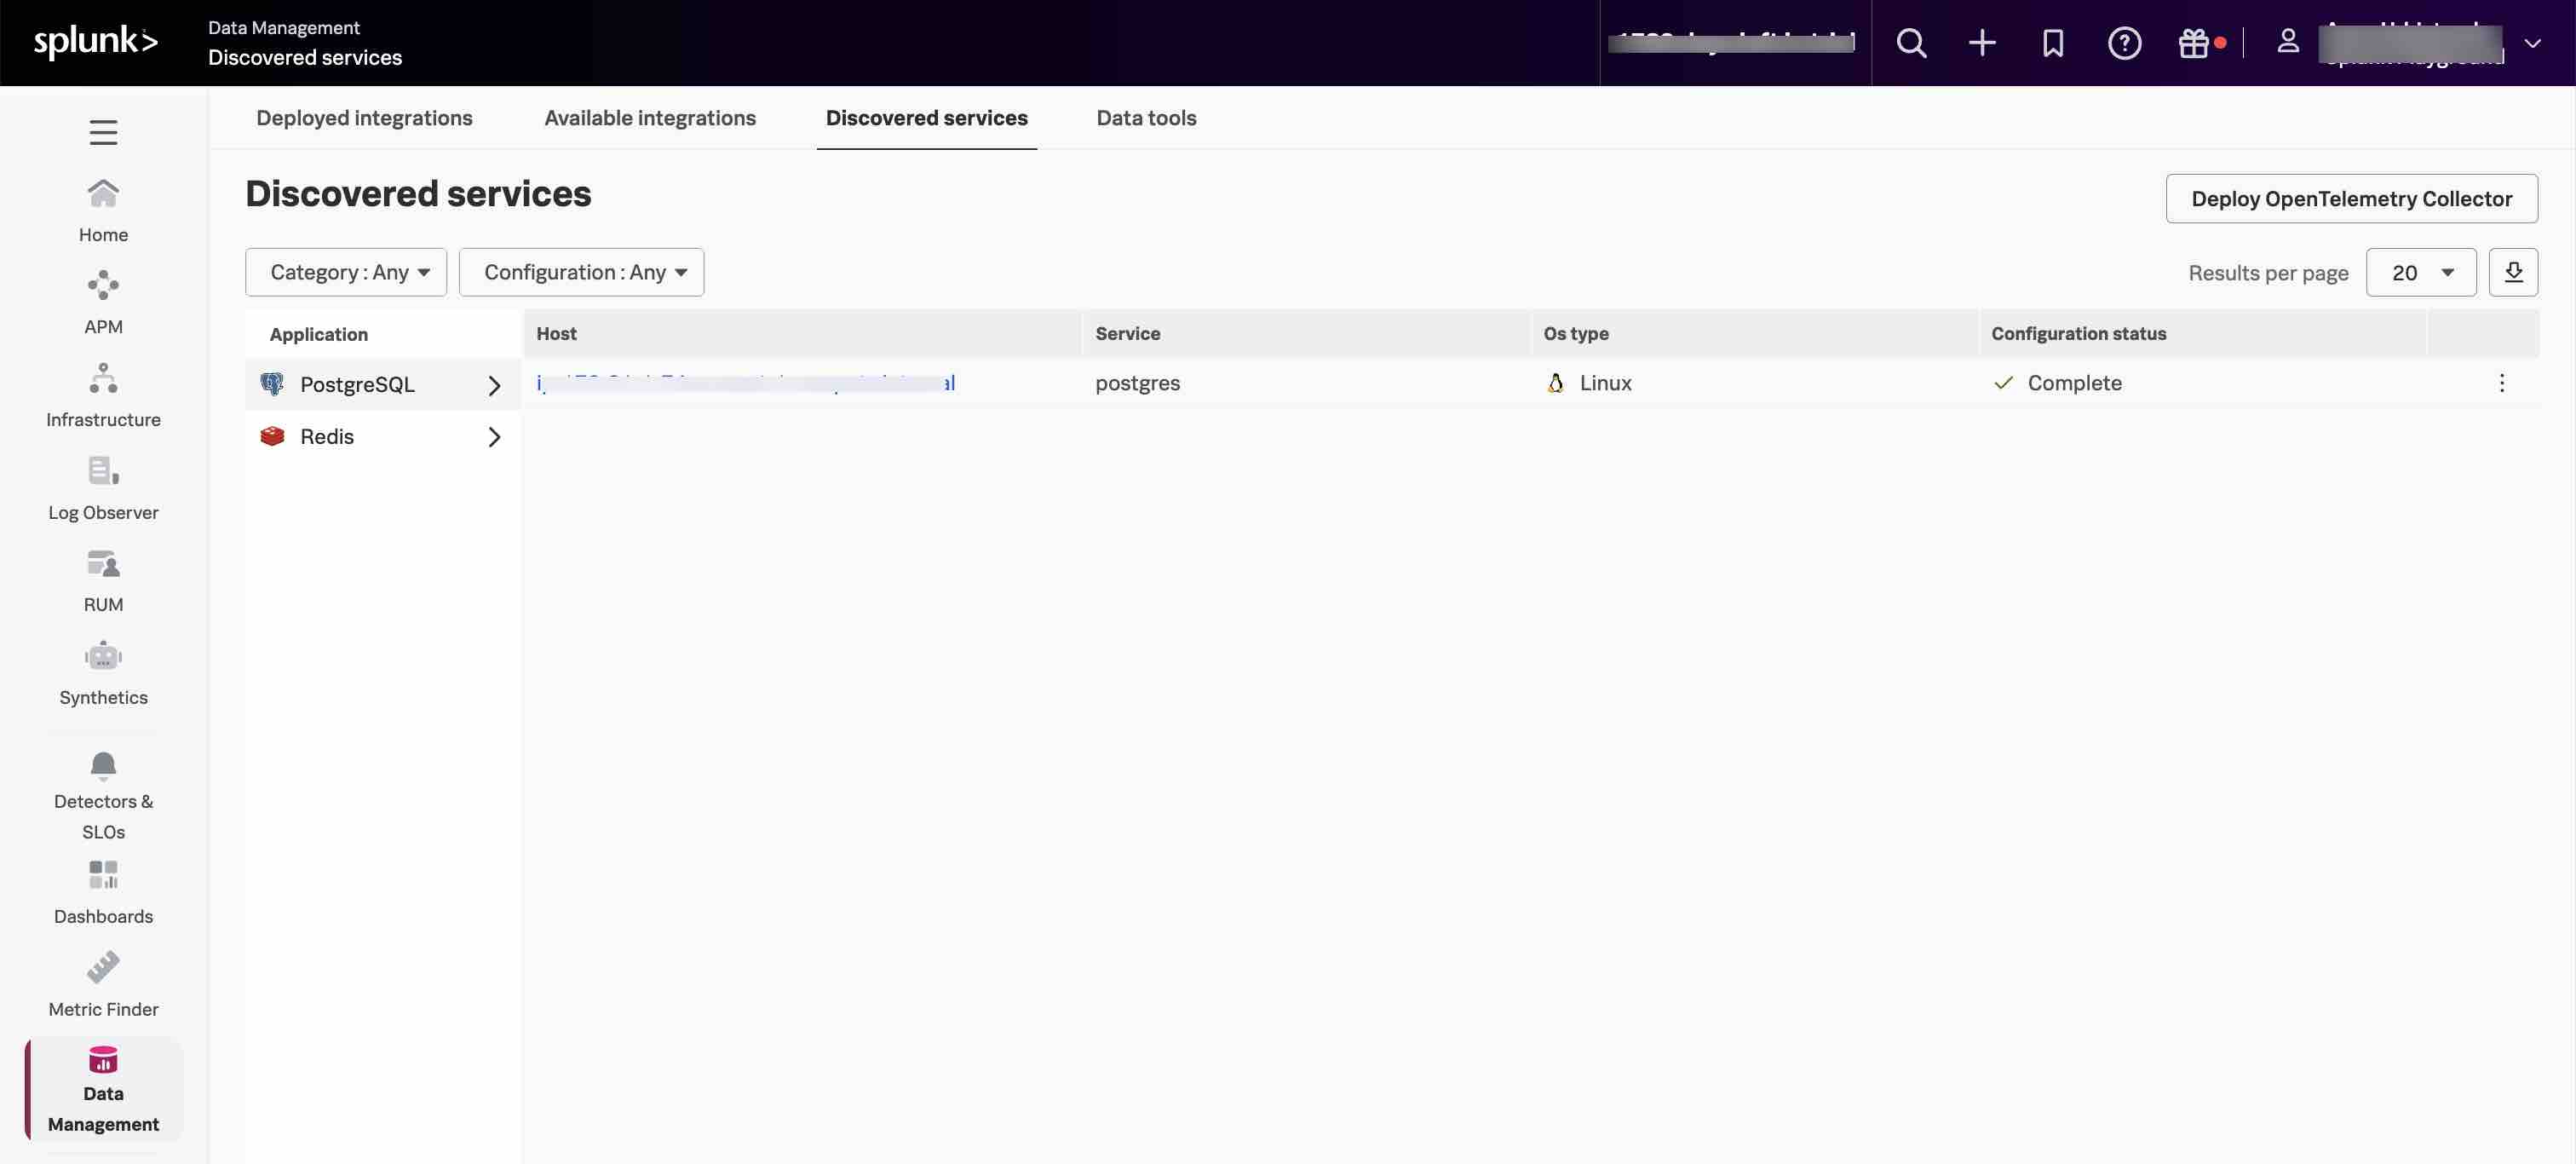
Discovered services in the UI
Kubernetes環境でCollectorバージョン0.109.0以降を使用している場合、Splunk Observability Cloudにログインし、Data Management メニューの Discovered services タブに移動すると、Collectorが検出したサービスおよびサードパーティ製アプリケーションのうち、自動で監視できるものを確認できます。
Supported language runtimes for zero-code instrumentation
Collector のオートディスカバリー経由のゼロコードインストルメンテーションは以下の言語で利用できます:
アプリケーション言語 |
Linux対応 |
Windows対応 |
Kubernetes対応 |
|---|---|---|---|
Java |
はい。Linux でのバックエンドアプリケーションのゼロコードインストルメンテーション を参照してください |
いいえ |
はい。Kubernetes でのバックエンドアプリケーションのゼロコードインストルメンテーション を参照してください |
.NET |
はい。Linux でのバックエンドアプリケーションのゼロコードインストルメンテーション を参照してください |
はい。Windows でのバックエンドアプリケーションのゼロコードインストルメンテーション を参照してください |
はい。Kubernetes でのバックエンドアプリケーションのゼロコードインストルメンテーション を参照してください |
Node.js |
はい。Linux でのバックエンドアプリケーションのゼロコードインストルメンテーション を参照してください |
いいえ |
はい。Kubernetes でのバックエンドアプリケーションのゼロコードインストルメンテーション を参照してください |