パート2: Splunk Observability CloudでAWSデータを監視および使用する 🔗
AWSサービスとの統合が完了したので、ナビゲーターとダッシュボードを使用してデータにアクセスし、AWSデータを検索して、ディテクターとアラートを設定することができます。チュートリアルの概要については、チュートリアル:Splunk Observability CloudでAWS環境を監視する を参照してください。
AWSデータの表示と管理 🔗
様々なツールを使用して、AWSデータへのアクセスと表示が行えます:
Infrastructure Monitoring のナビゲーターでメトリクスを表示 🔗
ナビゲーターは主にチャートで構成されています。チャートを使用すると、メトリクスの詳細を表示したり、メトリック時系列を視覚化したりできます。
以下の手順に従ってください:
Splunk Observability Cloud にログインします。
左側のナビゲーションメニューで、 を選択します。
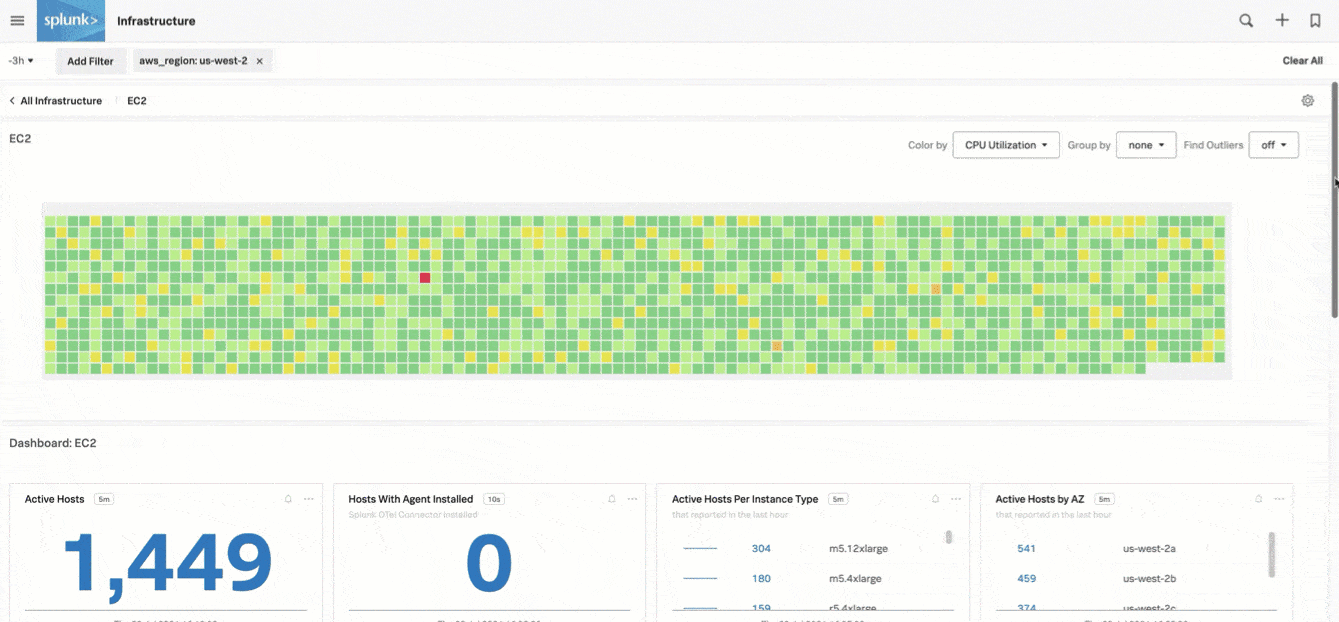
Public Clouds セクションで、Amazon AWS を選択します。Amazon AWS セクションは、Splunk Infrastructure Monitoringが受信したアマゾン ウェブ サービスデータの概要ビューを提供します。
![このスクリーンショットは、Splunk Infrastructure Monitoringが受信したデータのハイレベルビューを表示する[インフラストラクチャ]ページのAmazon AWSセクションを示しています。](../../../../../_images/amazonaws-section1.png)
サービスを選択して、そのナビゲーターにアクセスします。たとえば、ご利用のAmazon Elastic Compute Cloud(EC2)ノードに関するデータを提供するナビゲーターにアクセスできます。
内蔵ダッシュボードでAWSメトリクスを表示する 🔗
Splunk Observability Cloudは、Amazon Web Servicesのデータ探索に使用できる 内蔵ダッシュボード も提供します。
これらのダッシュボードにアクセスするには、以下の手順に従います:
左側のナビゲーションメニューで、 を選択します。
AWS を検索すると、利用可能なアマゾン ウェブ サービスダッシュボードグループが表示されます。
該当するダッシュボードのリンクを選択します。
AWSデータの検索 🔗
メトリクスファインダー を使用して特定のメトリクスを検索したり、メタデータカタログ を使用してメタデータを検索したりできます。
メトリクス・パイプライン管理を使用してメトリクスを管理する 🔗
メトリクス・パイプライン管理 を使用して、メトリクスのカーディナリティを一元管理し、メトリクスのインジェストと保存方法を制御することで、コストを削減し、監視パフォーマンスを向上させることができます。
アラートを発するディテクターを作成する 🔗
アラートを使用すると、データの特定の条件について常に情報を得ることができます。
アラートを作成するには、まず、アラートさせたい条件を満たすデータを監視するディテクターを作成します。このような条件が満たされると、ディテクターがアラートを発行します。
アラートを設定するには、以下の手順に従ってください:
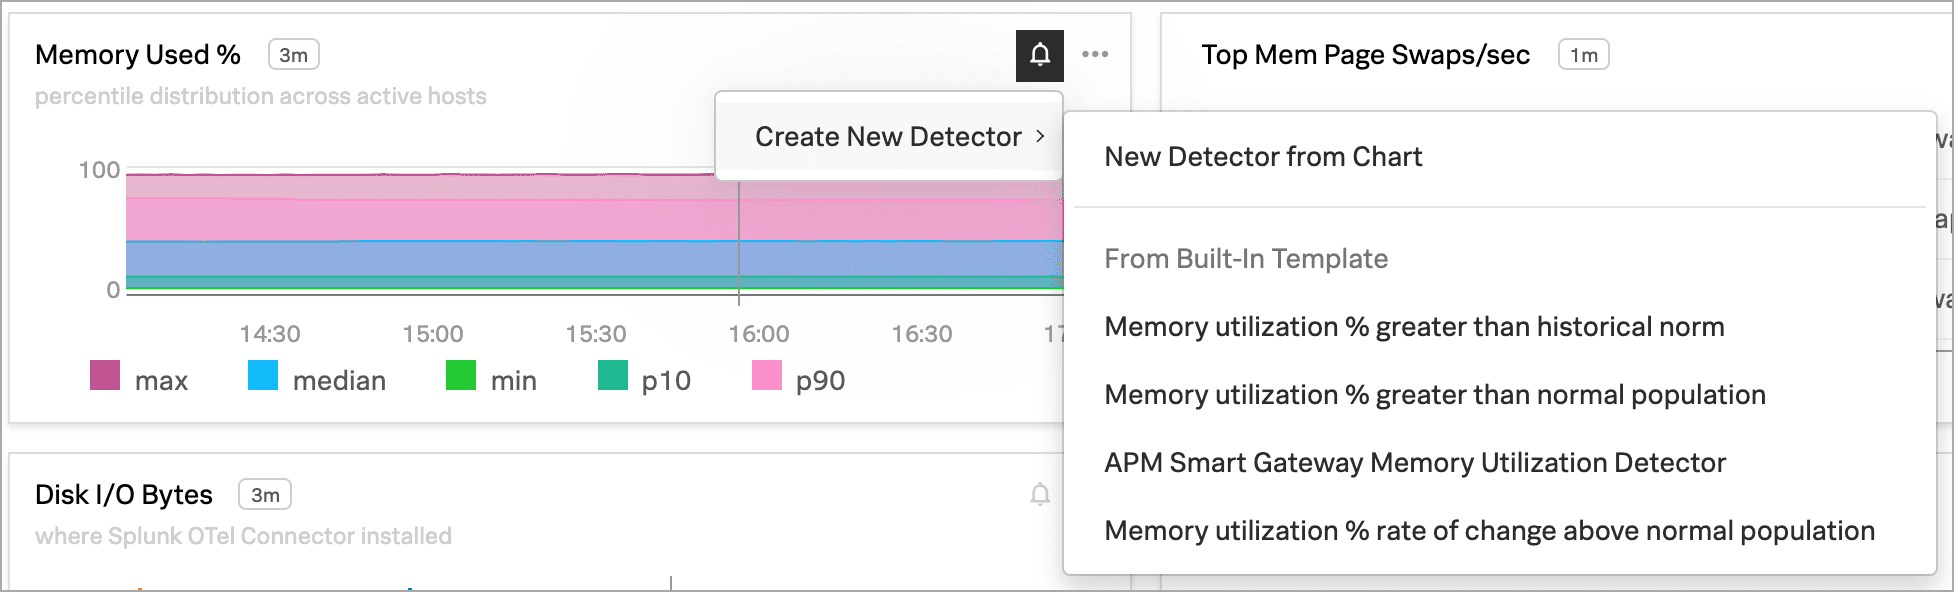
ディテクターを作成したいチャートにアクセスします。
チャート右上で Get Alerts アイコンを選択します。
このディテクターは、過去10分間のメモリ使用量が、過去24時間と比較して、通常よりも著しく多かった場合にアラートを送信します。
New Detector パネルが表示されます。Add Recipient を選択して、メール、Splunk Observability Cloud チーム、または Webhook など、アラートを受信する場所を追加します。
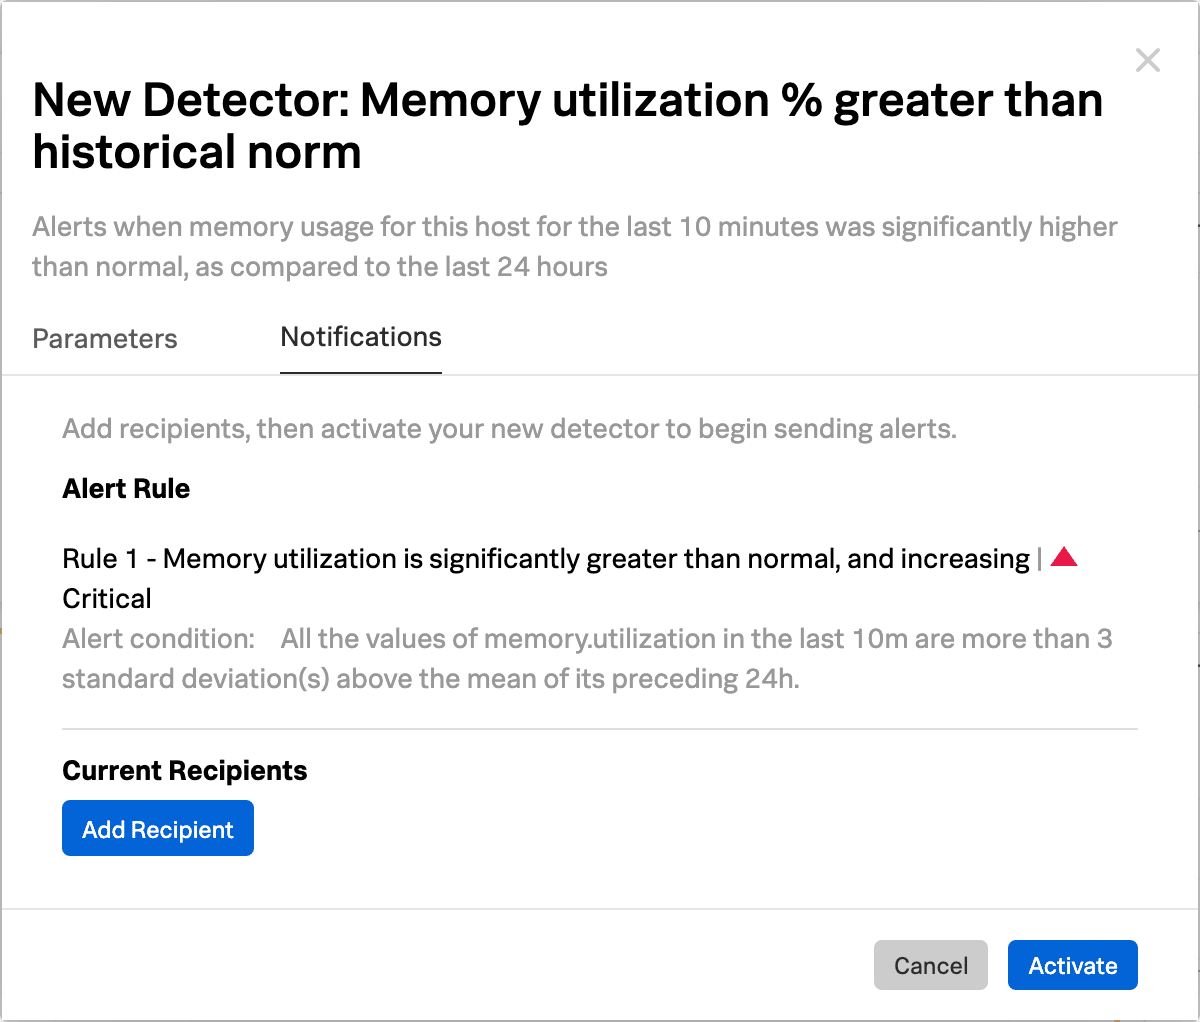
有効にする を選択します。データ条件が満たされると、Splunk Observability Cloudは指定した受信者に通知を送信し、アラートページにアラートを表示します。
次のステップ 🔗
これでチュートリアルは終了です。AWSサービスと Splunk Observability Cloud を接続し、ナビゲーターとダッシュボードでデータを表示し、AWSデータを検索して、ディテクターを作成しました。
さらに詳しく 🔗
チュートリアルのこの部分で説明する概念の詳細については、次を参照してください:
次に何を学ぶべきかについてのアイデアを得るために:
カスタムダッシュボードを作成する方法は、ダッシュボードの作成およびカスタマイズ および Splunk Observability Cloudのダッシュボード作成のベストプラクティス を参照してください。
関連データを選択してSplunk Observability Cloudのコンポーネント間をジャンプする方法については、Splunk Observability Cloudの関連コンテンツ を参照してください。
Splunk Observability Cloudを使用して監視できるデータソースについて詳しくは、Splunk Observability Cloud でサポートされているインテグレーション を参照してください。
チームアラートとダッシュボードを使用してSplunk Observability Cloudでチームの作業を調整する方法については、Splunk Observability Cloudでチームを作成および管理する を参照してください。
このチュートリアルおよびSplunk Observability Cloud全般で使用されるコンセプトの詳細は、Splunk Observability Cloudの概要 を参照してください。