パート1: Collectorをインストールし、KubernetesデータをSplunk Observability Cloudに取り込む 🔗
OpenTelemetry Collectorをデプロイする前に、稼働中のKubernetesクラスターが必要です。チュートリアルの概要については、チュートリアル:Splunk Observability CloudでKubernetes環境を監視する を参照してください。
注釈
このタスクから パート2: Kubernetesクラスターを監視する へのシームレスなフローを確保するために、インフラストラクチャホストまたはクラスターがSplunk Observability Cloudが受信できるデータを生成していることを確認してください。たとえば、このチュートリアルで使用するガイド付きセットアップで有効な接続の確認が得られても、インフラストラクチャが積極的にSplunk Infrastructure Monitoringにデータを送信していない限り、ナビゲーターは表示されません。
KubernetesデータをSplunk Observability Cloudに取り込む 🔗
Splunk Observability Cloud にログインします。
Add Integration ボタンを選択するか、左のナビゲーションメニューで Data Management を選択して、データのインテグレーション ページを開きます。
Deploy the Splunk OpenTelemetry Collector を選択し、Next を選択します。[インストール設定]画面が表示されます。
Platform メニューで、Kubernetes を選択します。セットアップガイドが開きます。
Collectorインスタンスを構成するために、ご利用の環境に適した値を入力します。
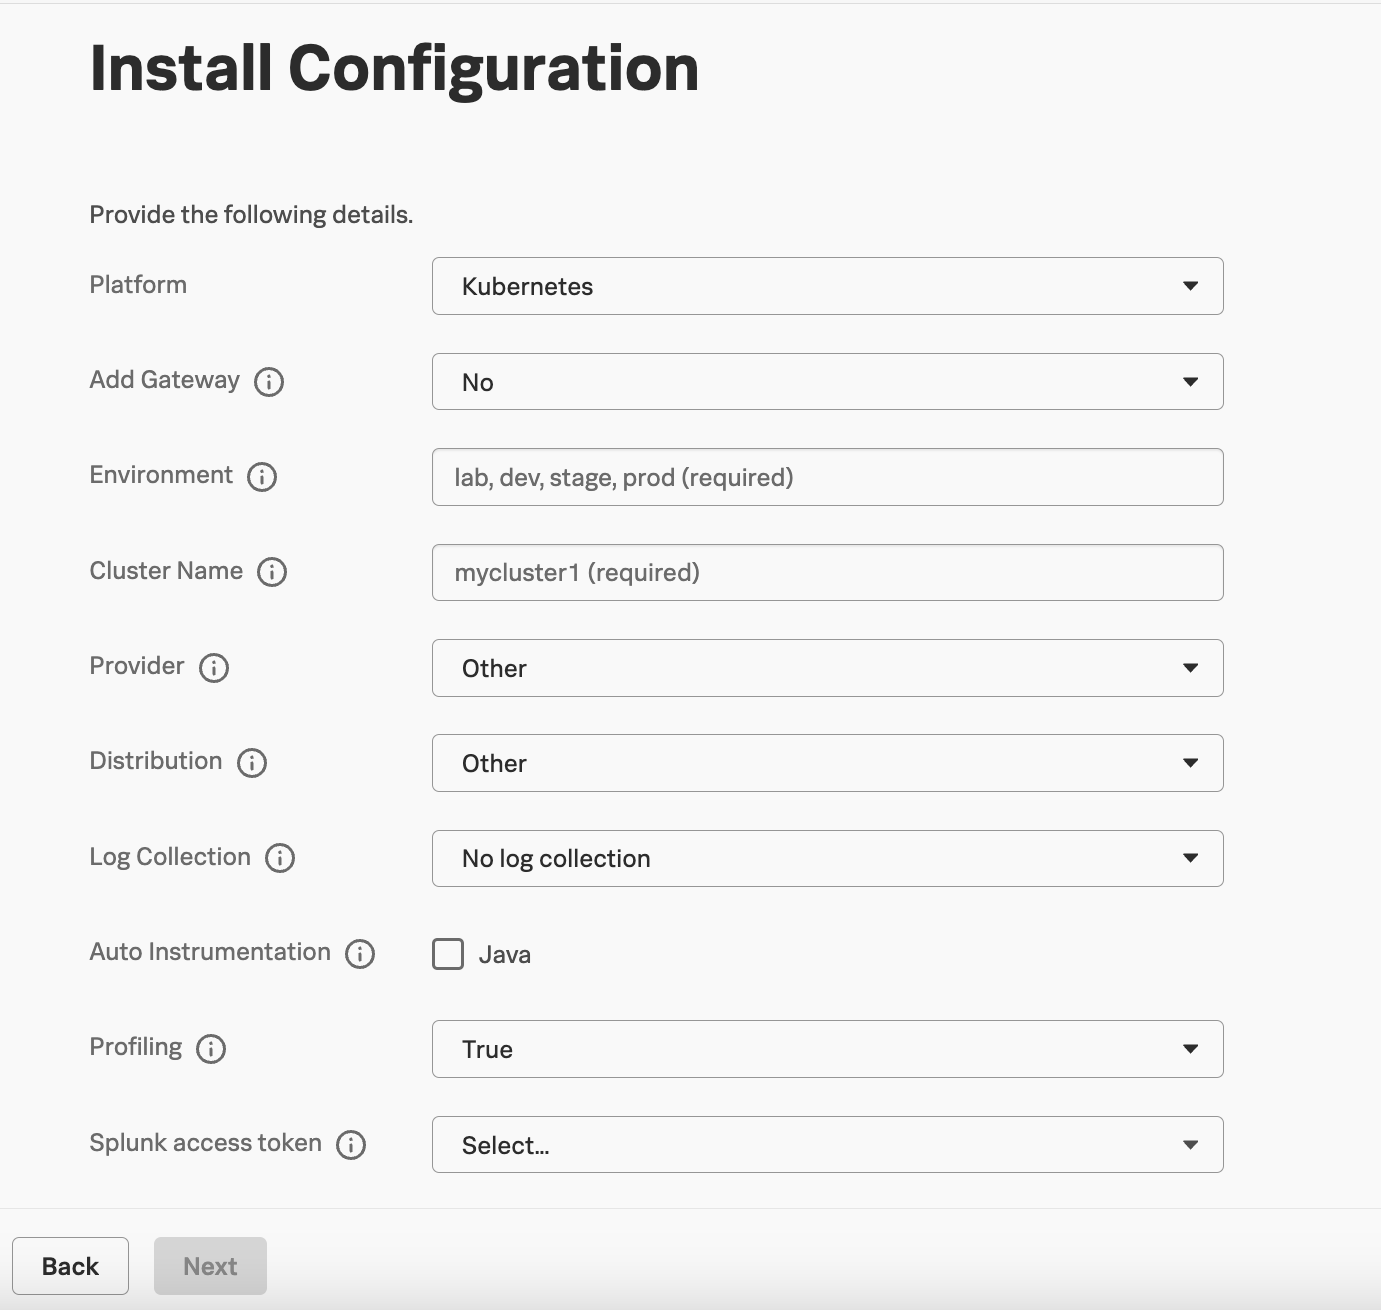
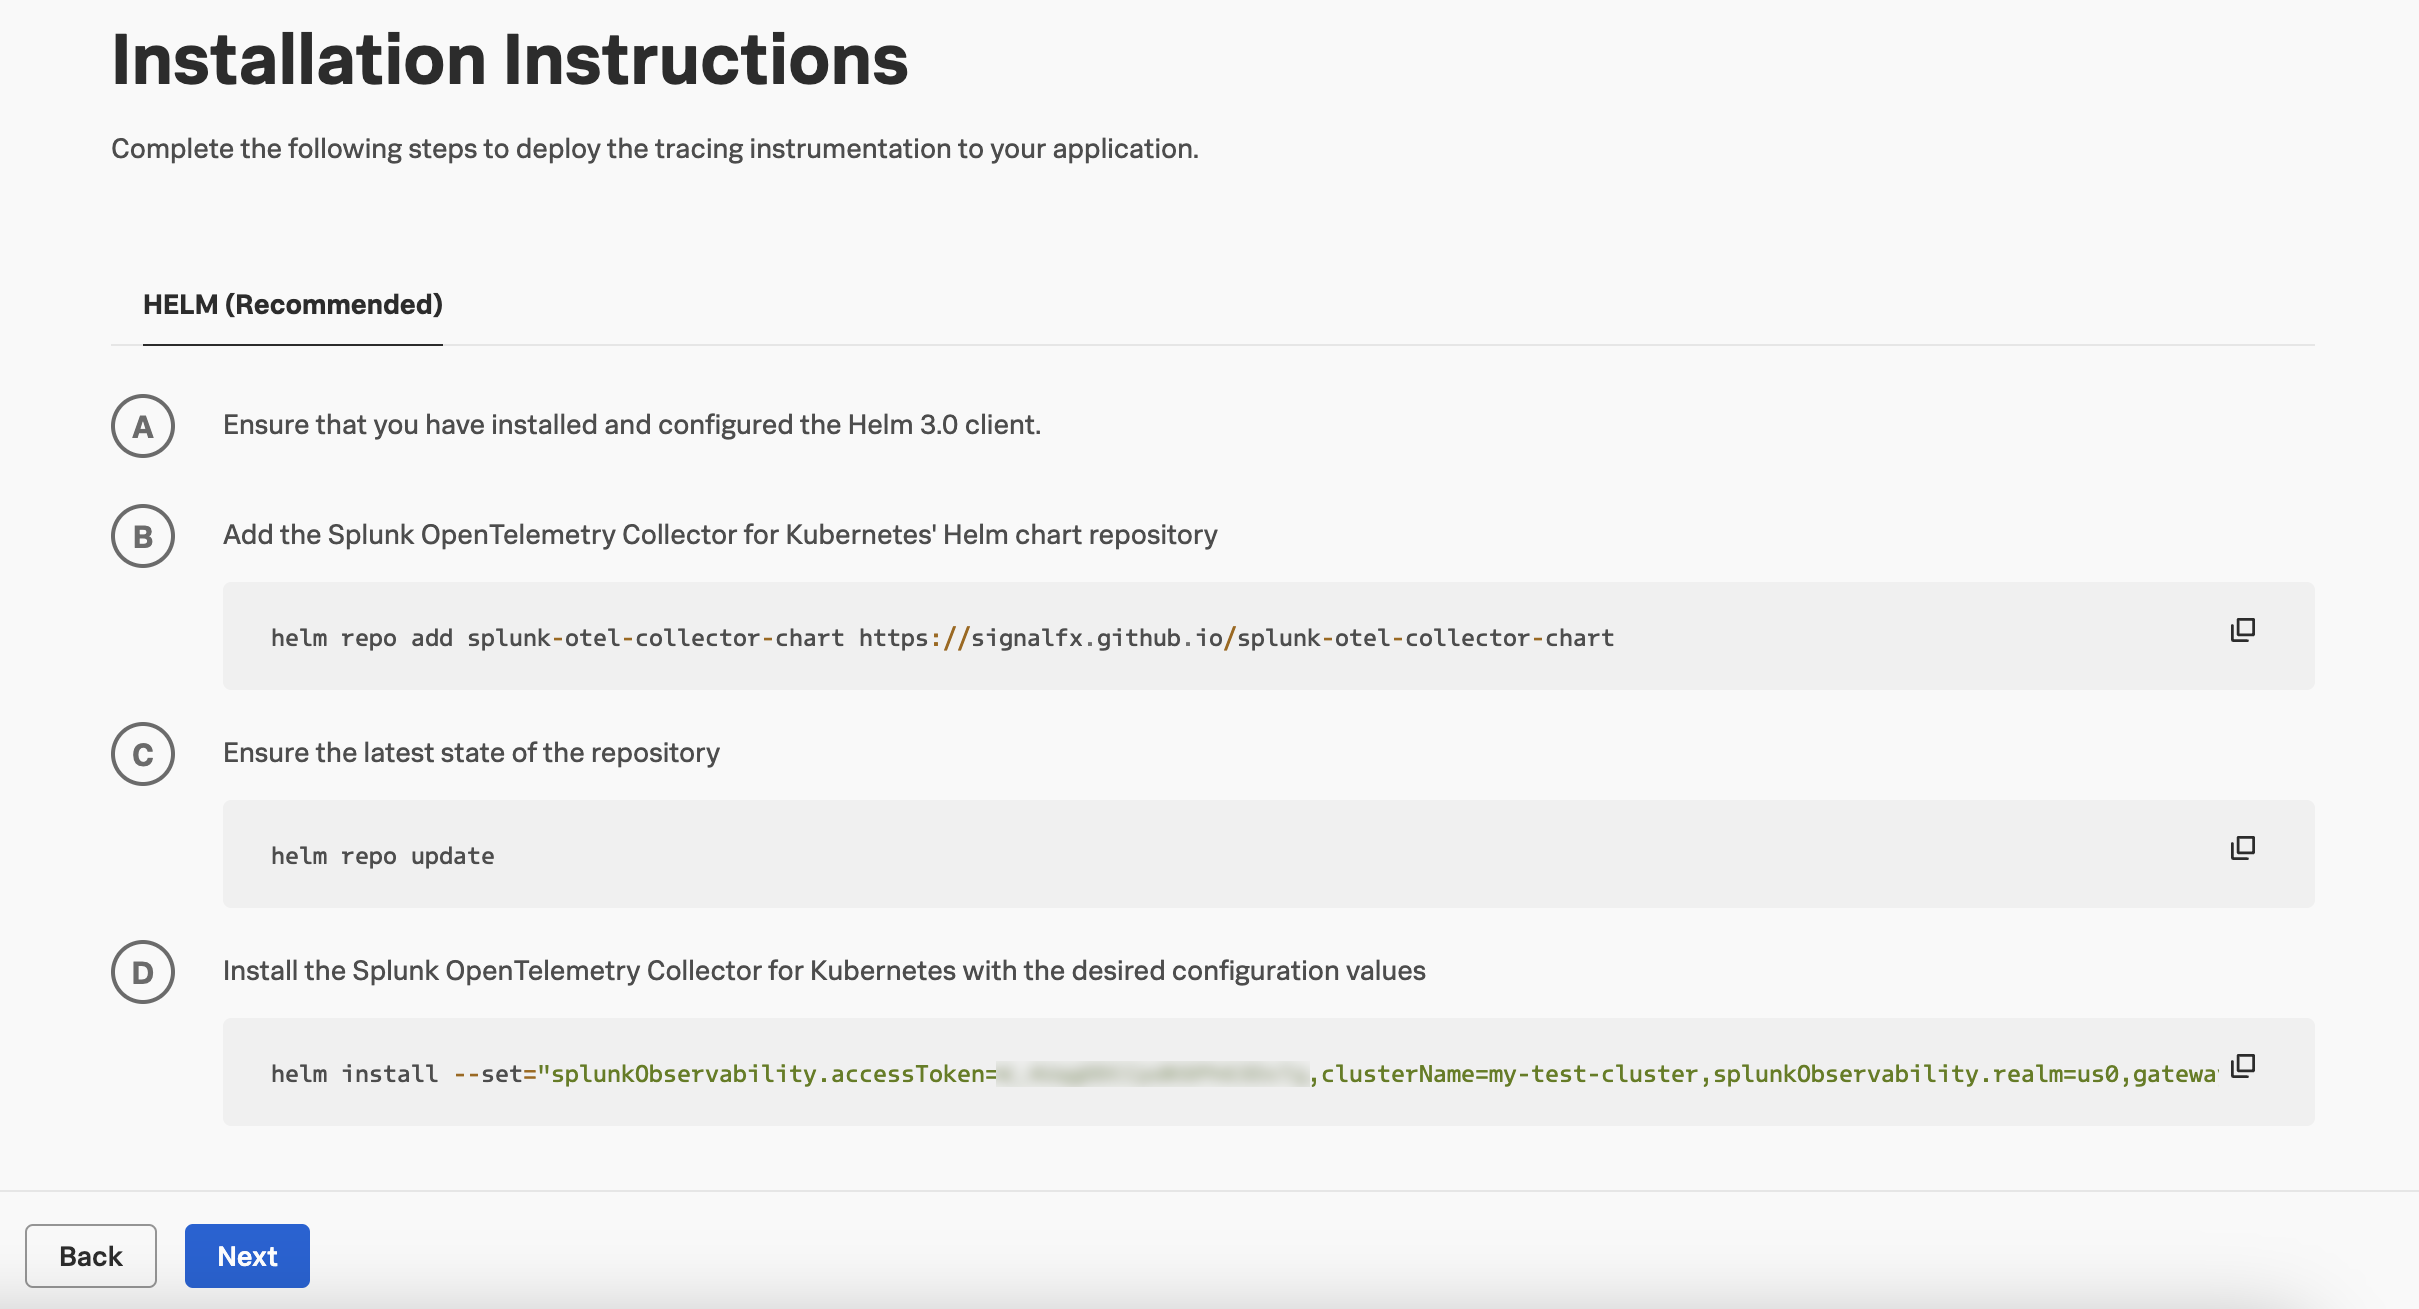
Next を選択します。Installation Instructions画面が表示されます。Configure Integration画面で入力した内容に基づいて、選択したプラットフォームにSplunk Distribution of OpenTelemetry Collectorをインストールするためにコピー&ペーストできるコマンドを提供します。
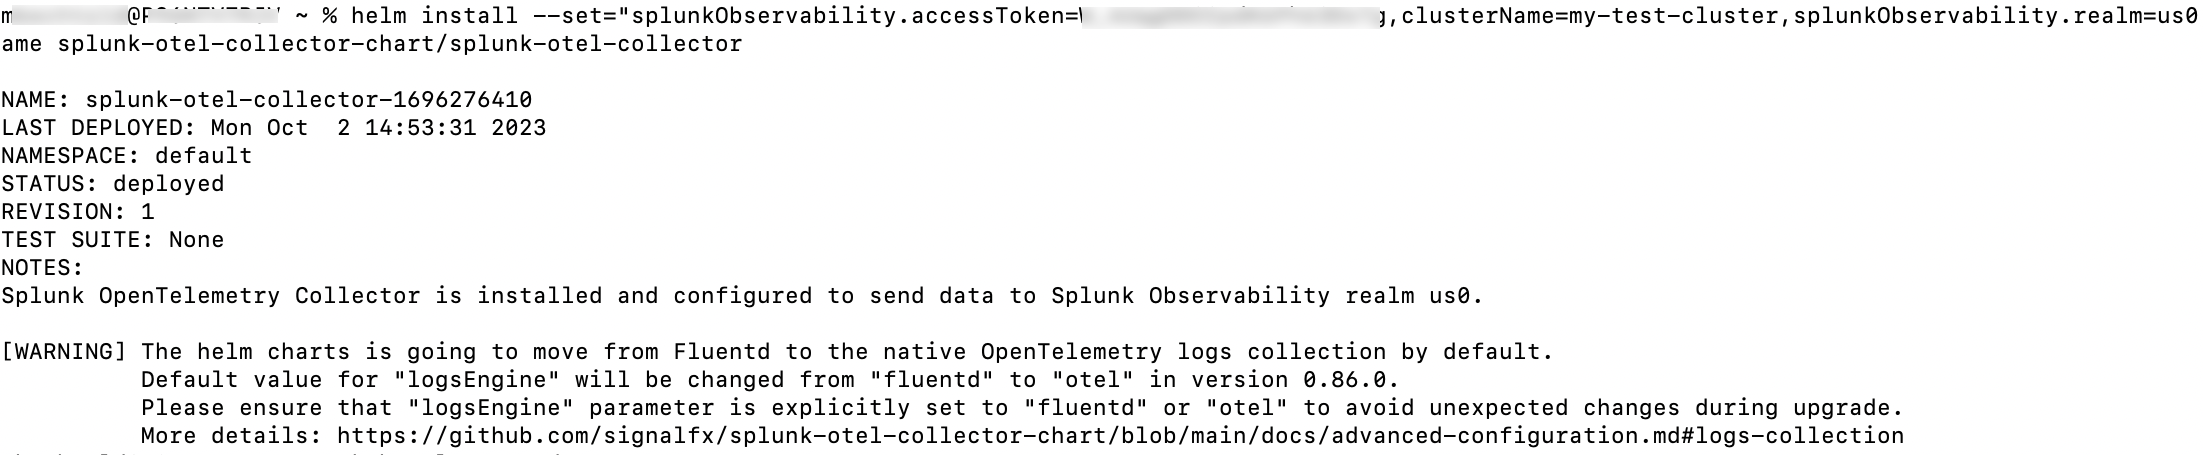
Kubernetesクラスターを起動し、[インテグレーションの設定]画面で得られたコマンドを使用して、Splunk Distribution of OpenTelemetry Collectorをデプロイします。次の画像は、Collectorのインストールが成功したことを示すものです:
Collectorをデプロイしたら、[インテグレーションの設定]画面に戻り、Next を選択します。[インベントリの確認]画面にKubernetesデータの概要が表示されます。
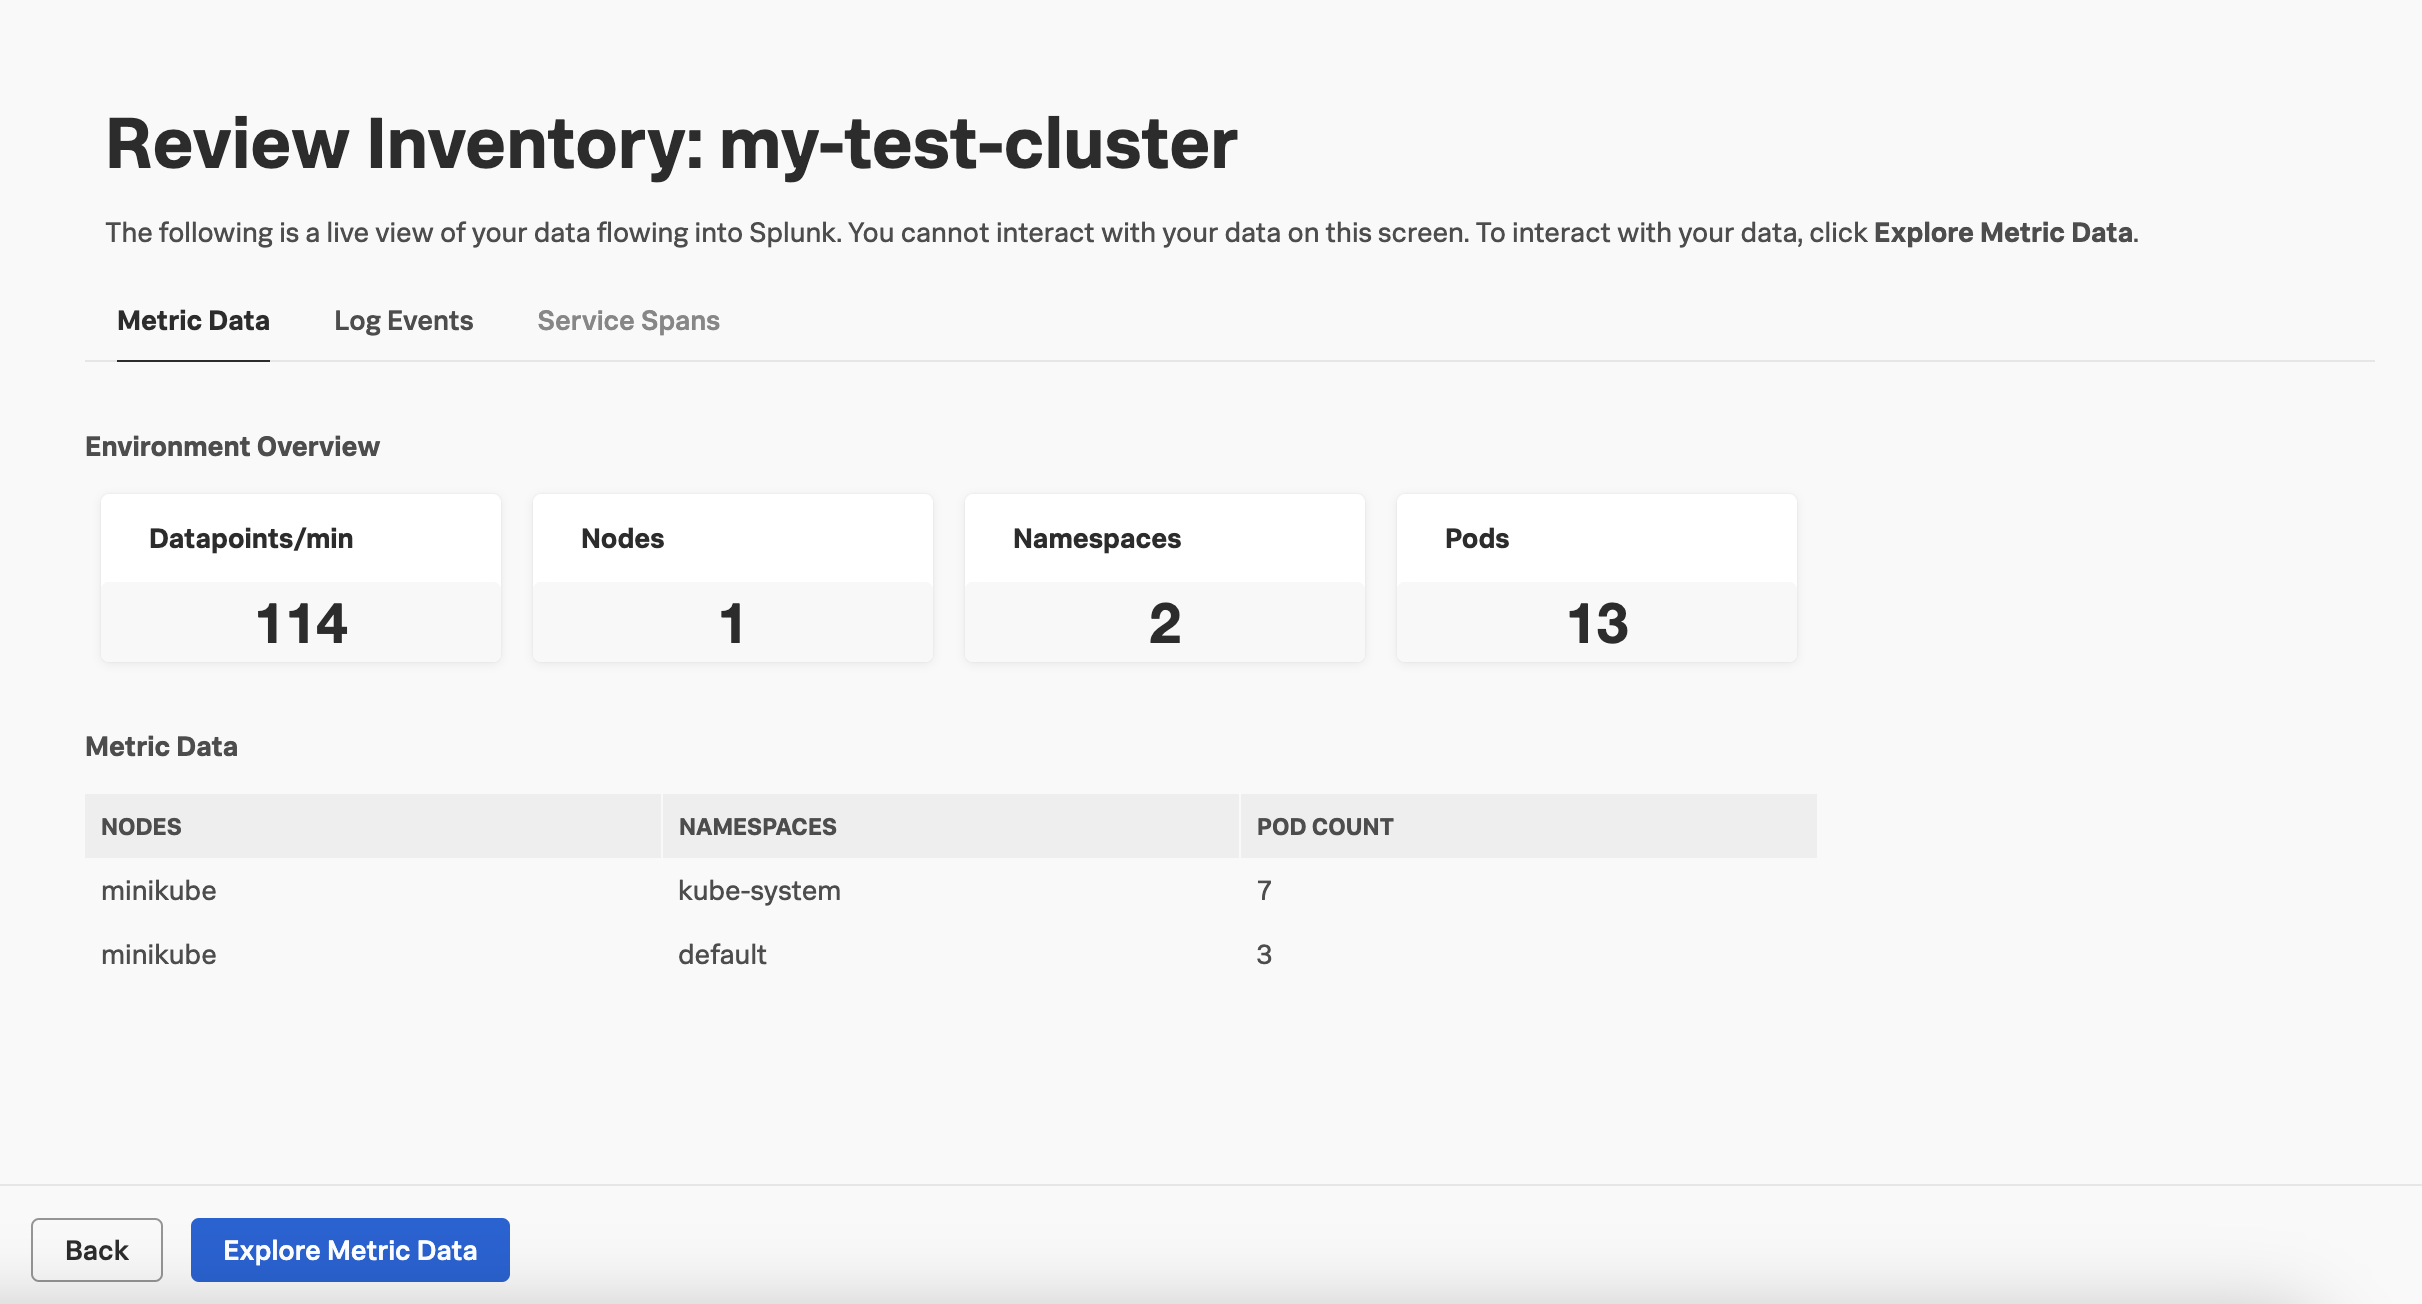
(オプション) Explore Metric Data を選択して、データをさらに操作します。
次のステップ 🔗
これでチュートリアルの最初のパートは終了です。KubernetesクラスターにCollectorをデプロイし、データがSplunk Observability Cloudに流れ込むことを確認しました。
次に、内蔵のダッシュボードとナビゲーターを使用してKubernetesデータを監視する方法を学習します。続行する場合は、パート2: Kubernetesクラスターを監視する を参照してください。