パート2: Kubernetesクラスターを監視する 🔗
これでKubernetesクラスターデータがSplunk Observability Cloudに流れるようになったので、組み込みのナビゲーターを使ってデータを探索できるようになりました。チュートリアルの概要については、チュートリアル:Splunk Observability CloudでKubernetes環境を監視する を参照してください。
注釈
ナビゲーターは、Splunk Infrastructure Monitoringがご利用のソースからデータを受信している場合にのみ表示されます。
たとえば、パート1: Collectorをインストールし、KubernetesデータをSplunk Observability Cloudに取り込む で使用したガイド付きセットアップで有効な接続の確認が得られたとしても、ホスト、Kubernetesクラスター、またはクラウドプロバイダのサービスがSplunk Infrastructure Monitoringにアクティブにデータを送信していない限り、ナビゲーターは表示されません。
有効な接続を行ってから15分経過してもナビゲーターが表示されない場合は、ソースを確認して、そのソースがデータを生成していることを確認してください。たとえば、ホスト、クラスター、またはサービスが、Splunk Infrastructure Monitoringに送信できるデータを生成していることを確認します。
Kubernetesナビゲーターを使用してKubernetesクラスターを監視する 🔗
Splunk Distribution of OpenTelemetry Collectorをインストールしたら、Kubernetesナビゲーターを使用してクラスターのデータを探索します。
Splunk Observability Cloud にログインします。
左側のナビゲーションメニューで、Infrastructure を選択します。
Containers セクションで、Kubernetes を選択します。
Kubernetes nodes など、Kubernetesサービスを選択します。Kubernetesナビゲーターが表示されます。
注釈
デフォルトでは、Kubernetesクラスターはサービスごとに分かれています。すべてのKubernetesクラスターのマップを表示するには、Switch to classic navigator を選択します。
Splunk Distribution of OpenTelemetry Collectorをインストールしたクラスターなど、ナビゲーターに表示されるデータを特定のクラスターにフィルターリングするには、Cluster の値を指定したクラスター名に設定します。
内蔵ダッシュボードを使用してKubernetesデータを探索する 🔗
Splunk Observability Cloudは、Kubernetesデータを探索するために使用できる内蔵ダッシュボードも提供しています。どの内蔵ダッシュボードが利用可能かを確認するには、Splunk Observability Cloudのダッシュボード を参照してください。
内蔵ダッシュボードにアクセスするには、以下の手順に従ってください:
ナビゲーション Menu を開き、Dashboards を選択します。ダッシュボード]ページが表示されます。
Kubernetes を検索します。 Kubernetes ダッシュボードグループが表示されます。
リンクを選択すると、関連するダッシュボードにアクセスできます。
ナビゲーターで作業するためのヒント 🔗
ナビゲーターは主にチャートで構成されています。チャートを使用すると、メトリクスの詳細を表示したり、メトリック時系列を視覚化したりできます。
チャートにカーソルを合わせると、特定のメトリック時系列の詳細が表示されます。
チャート内で選択すると、指定した期間のデータテーブルが表示されます。
チャートの左上にあるチャートタイトルを選択すると、プロットエディターや、チャートの視覚エフェクトタイプを面グラフ、カラムチャート、ヒストグラムに変更する機能などの追加のチャートオプションとともに、完全なチャートが表示されます。
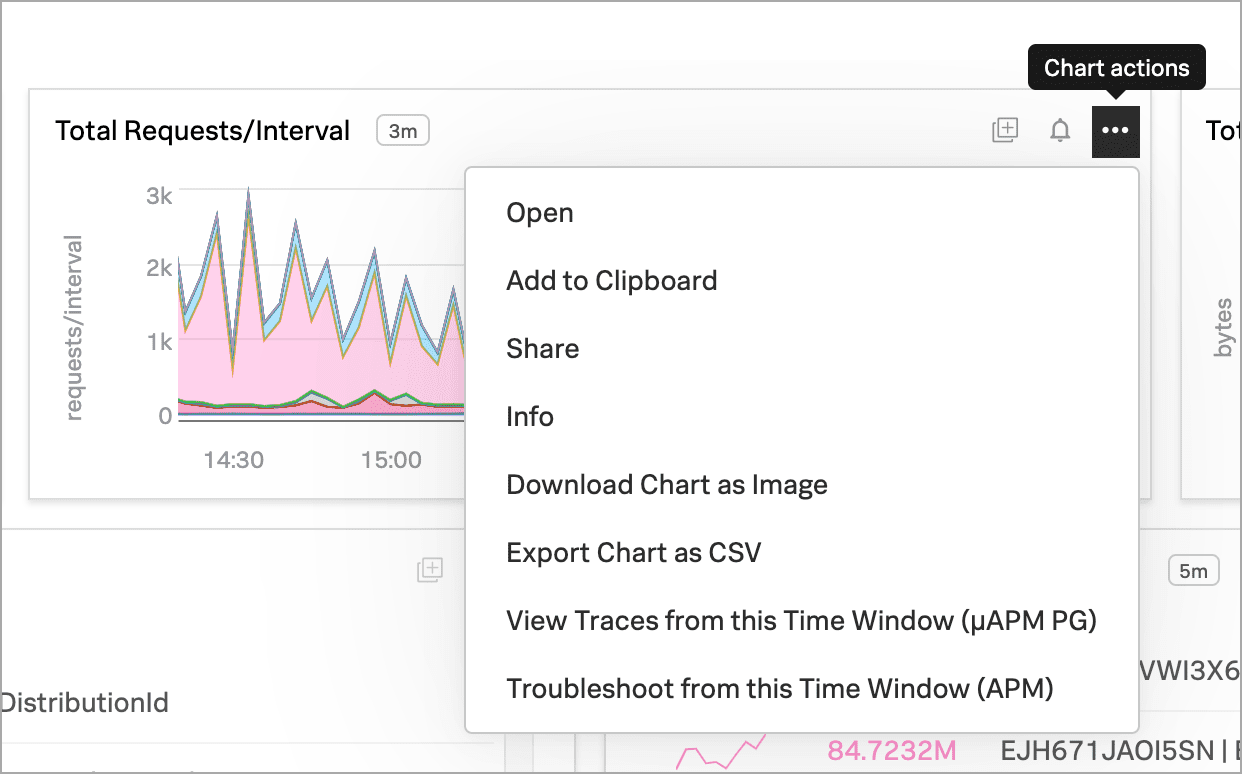
すべてのチャートには Chart Actions メニューがあります。チャートの右上にある「その他」(⋯ )のアイコンを選択すると、メニューが開き、利用可能なアクションが表示されます。例えば、チャートを共有したり、画像としてダウンロードしたり、カンマ区切り値(CSV)ファイルとしてエクスポートしたりできます。
次のステップ 🔗
これで、チュートリアルのパート2は終了です。組み込みのナビゲーターを使用してデータを探索する方法を学びました。
次に、Kubernetesのデータについてアラートする組み込みディテクターを作成する方法を学びます。続行する場合は、パート3: 内蔵ディテクターを有効化してアラートを発する を参照してください。
さらに詳しく 🔗
一般的なナビゲーターの使用方法の詳細は、Splunk Infrastructure Monitoringのナビゲーターの使用 を参照してください。
Kubernetesナビゲーターに表示されるデータの詳細については、Kubernetesナビゲーターの使用 を参照してください。
チャートの操作の詳細については、Splunk Observability Cloudのチャート を参照してください。