Splunk On-CallのDotcom monitorインテグレーション 🔗
このガイドでは、Dotcom monitorとSplunk On-Callのアラートインテグレーションを有効にする方法を説明します。Splunk On-CallとDotcom monitorのインテグレーションでは、Dotcom monitorのアラートがトリガーされると、Splunk On-Callのタイムラインにインシデントが作成されます。
要件 🔗
このインテグレーションは以下のバージョンのSplunk On-Callと互換性があります:
Starter
Growth
エンタープライズ
設定 🔗
ドットコムモニターポータルにログインします。
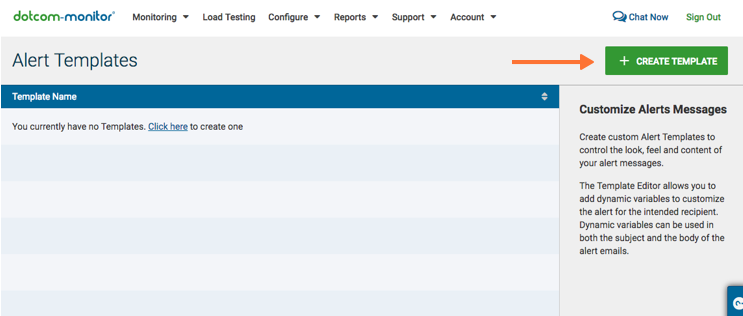
Configure、Alert Templates、Create Template を選択します。
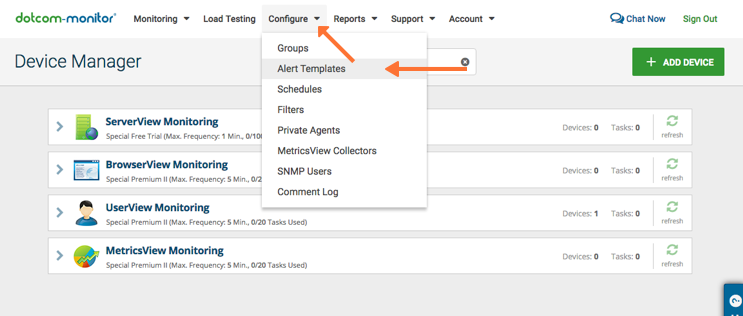
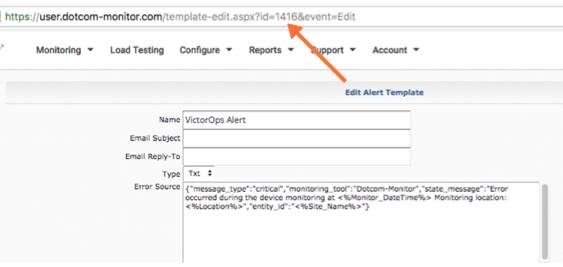
アラートテンプレートの入力済みコンテンツを削除し、Error Source、Test Source、Uptime Source フィールドに以下の情報を入力します:
Name
ここに名前を入力
メール件名
N/A
メール返信先
メールをここに入力
タイプ
Txt
エラーソース
{“message_type”:”c ritical”,”monitoring_tool”:”Dotco m-Monitor”,”state_message”:”Error occurred during the device monitoring at <%Monitor_DateTime%> Monitoring location:<%Locatio n%>”,”entity_id”:”<%Site_Name%>”}
テストソース
{“message_type”:” critical”,”monitoring_tool”:”Dotc om-Monitor”,”state_message”:”Test message”,”entity_id”:”Test message”}
Uptimeソース
{“message_type”:”re covery”,”monitoring_tool”:”Dotcom -Monitor”,”state_message”:”Device <%Site_Name%> detected to be back online at <%Monitor_DateTime%> from monitoring location: <%Locatio n%>”,”entity_id”:”<%Site_Name%>”}
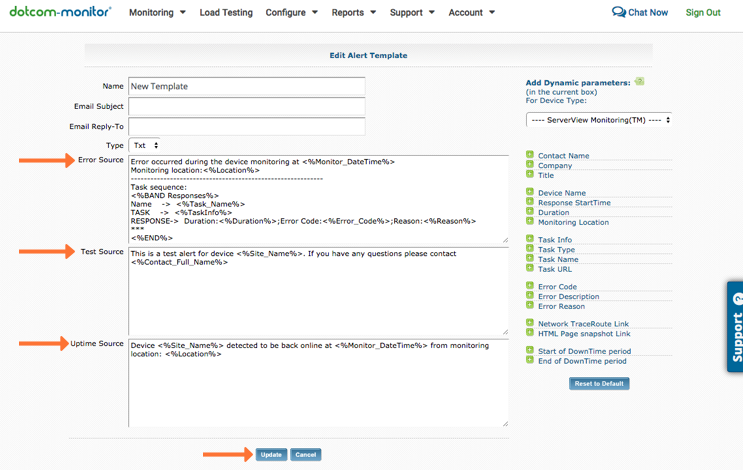
Update を選択して、アラートテンプレートを保存します。
メニューから Configure / Alert Templates を選択し、新しく作成したSplunk On-Call Alertを選択します。URLフィールドからテンプレートIDを取得して保存します。
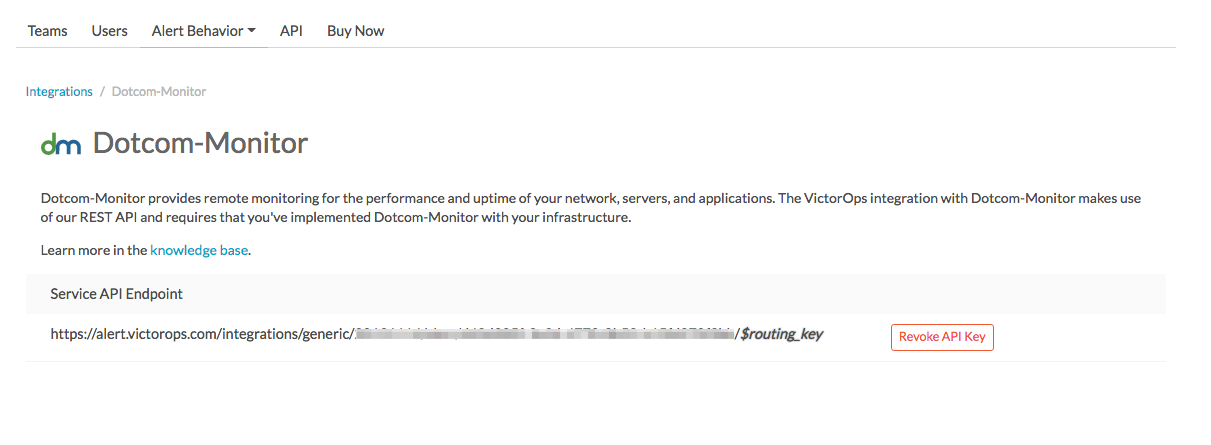
Splunk On-Callで、管理者ユーザーとして、Integrations、Dotcom-Monitor を選択します。
インテグレーションがアクティブでない場合は、Enable Integration を選択してエンドポイントURLを生成します。
$routing_keyセクションを使用するルーティングキーに置き換えてください。
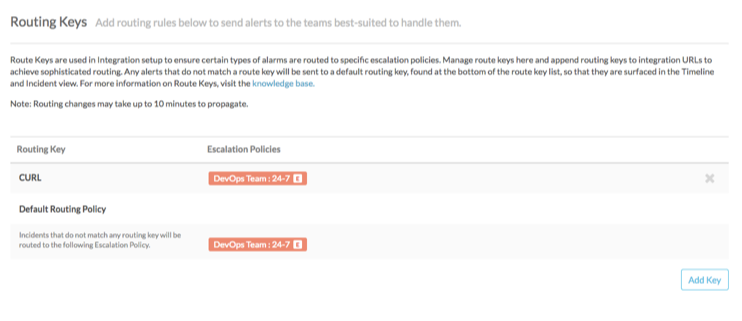
チームを作成または編集し、アラートを受信するユーザーを追加します。エスカレーションポリシーを追加します。ルーティングキーの設定が完了すると、ルーティングキーが表示されることに注意してください。
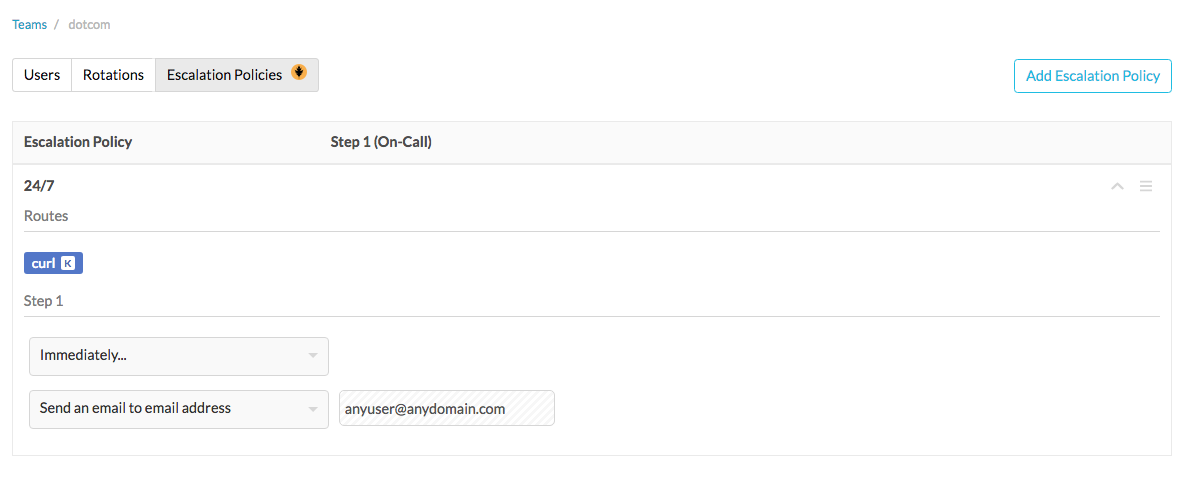
curlという名前の Add Key を使用して、ルーティングキーを追加します。次にエスカレーションポリシーを追加します。デフォルトルーティングポリシーを設定します。
Dotcom monitorに戻り、デバイスを編集します。Alert Options セクションに移動し、カスタムスクリプトファイルを選択します。Custom Script フィールドに以下の値を追加します:
Url_PostExecutor.cs “<Service API Endpoint/Routing Key>” “<Template ID>”例:
Url_PostExecutor.cs “https://alert.victorops.com/integrations/generic/20131114/alert/aa57b71c-8374-48ef-a649-fe15ed19a88ff/CURL” “1416”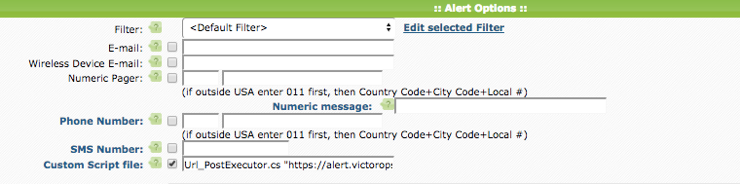
この設定を保存するには、Update を選択します。
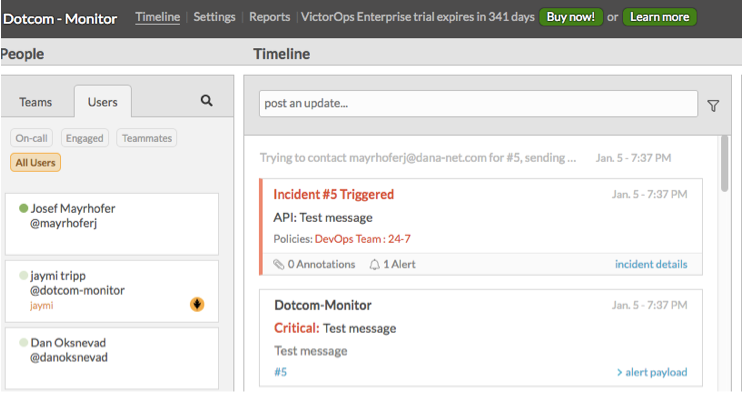
インテグレーションのテスト 🔗
Send test alert を選択します。スクリーンショットは、テストアラートの送信を開始する方法を示しています。
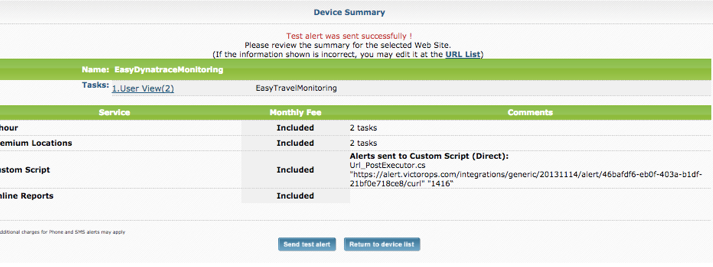
Splunk On-Callアカウントに戻り、タイムラインが表示されていることを確認します。アラートが受信されていることを確認します。