Splunk On-CallのためのSplunkインテグレーション 🔗
次のガイドでは、Splunk On-CallとSplunk Enterprise およびSplunk Cloud Platformの検索からのアクションアラートを統合する方法を示します。
要件 🔗
このインテグレーションは以下のSplunkバージョンをサポートしています:
Splunk Enterprise: 9.1、9.0、8.2、8.1、8.0、7.3、7.2、7.1、7.0
Splunk Cloud Platform: 9.1、9.0、8.2、8.1、8.0、7.3、7.2、7.1、7.0
以下のロールと能力が求められます:
v.1.0.23以降の場合
セットアップと設定には次が必要です:
admin
victorops_adminとadmin_all_objects
list_storage_passwords and admin_all_objects
使用とテストには次が必要です:
admin
victorops_admin
victorops_user
v.1.0.18以下の場合、セットアップとコンフィギュレーションを行うには、以下の条件を満たす必要があります:
list_storage_passwords AND admin_all_objects
オンプレミスインストールの場合、Splunk On-Callとの送信通信用にポート443を開きます。使用する完全なURLは以下の形式です:
https://alert.victorops.com/integrations/generic/20131114/alert/<your_api_key>/<your_routing_key>
Splunk Enterpriseの設定 🔗
注釈
アプリを新しいバージョンにアップデートする際は、bumpコマンドを実行して、キャッシュされたクライアントとサーバーのアセットをクリアしてください。詳しくは カスタマイズオプション をご覧ください。
In Splunk On-Call 🔗
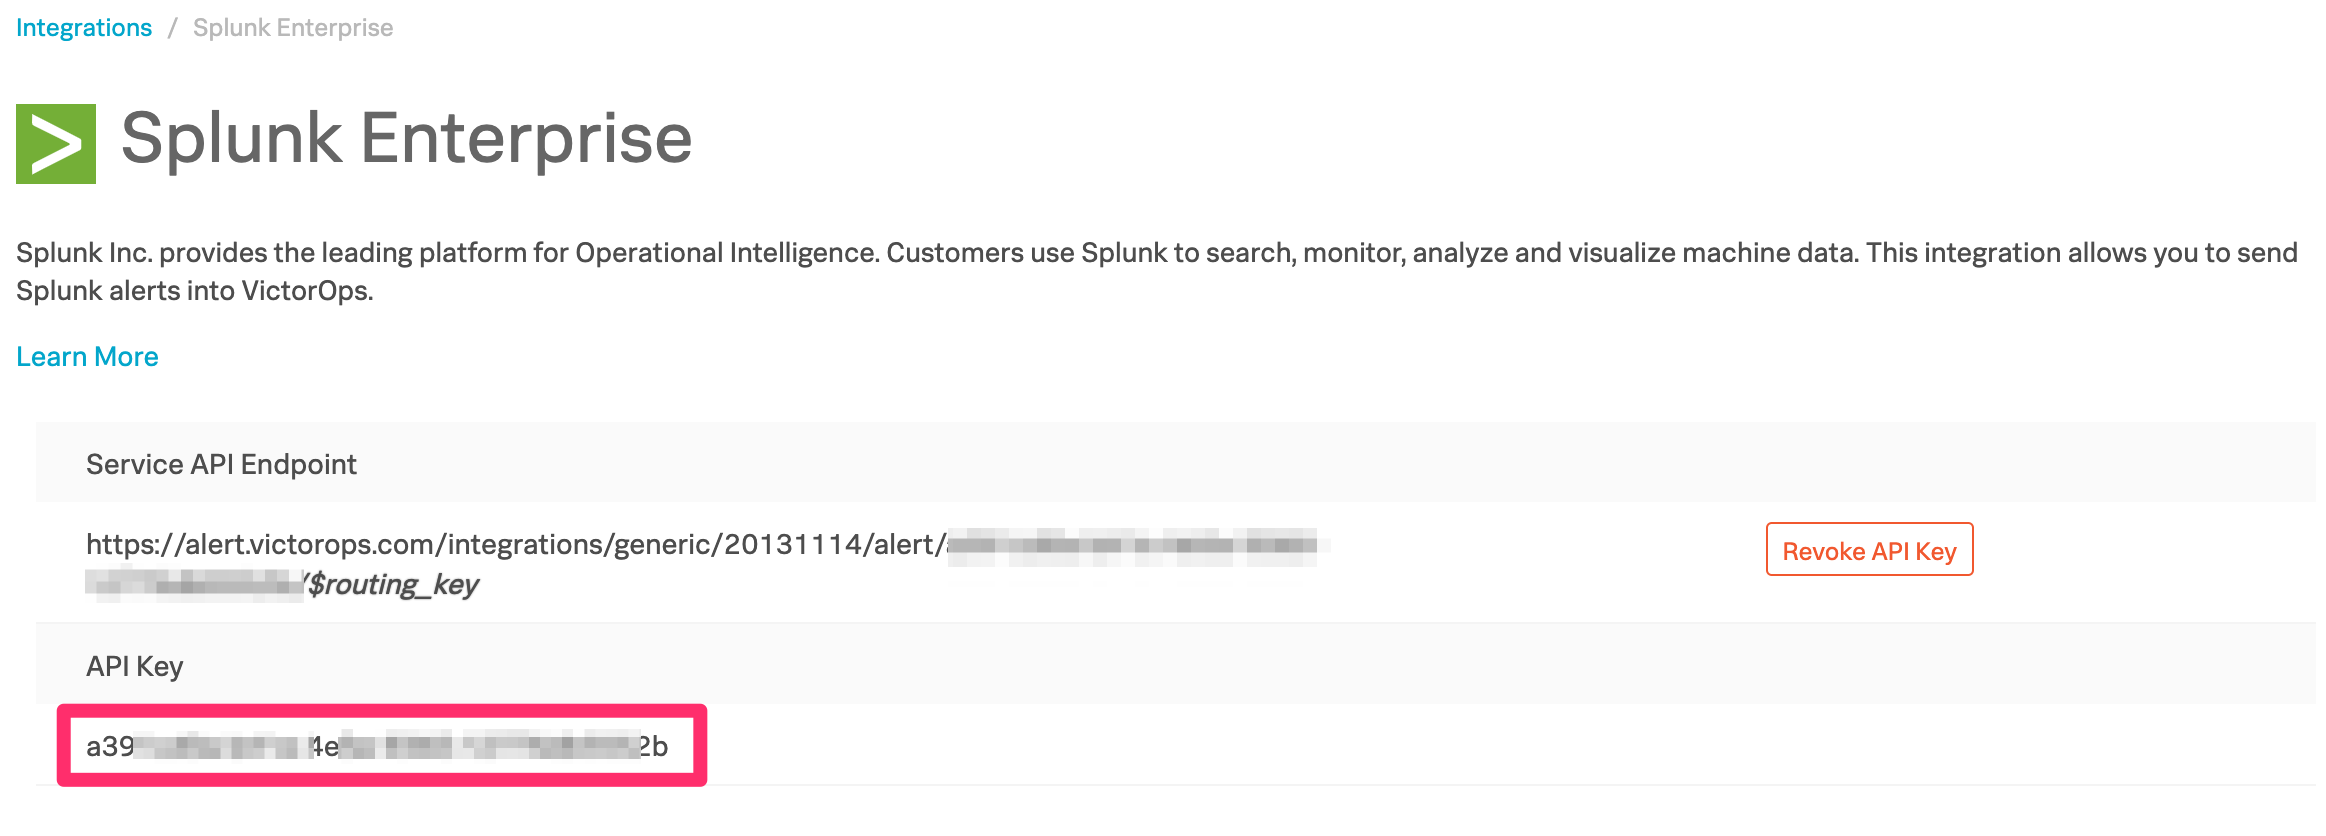
Splunk On-Callから Integrations、3rd Party Integrations、Splunk Enterprise に移動し、Enable Integration を選択します。後の手順で使用するため、APIキーをクリップボードにコピーします。
In Splunk Enterprise 🔗
Splunk BaseでSplunk On-Callを検索します。Download を選択し、チェックボックスにチェックを入れてライセンス契約に同意し、Agree to Download を選択します。
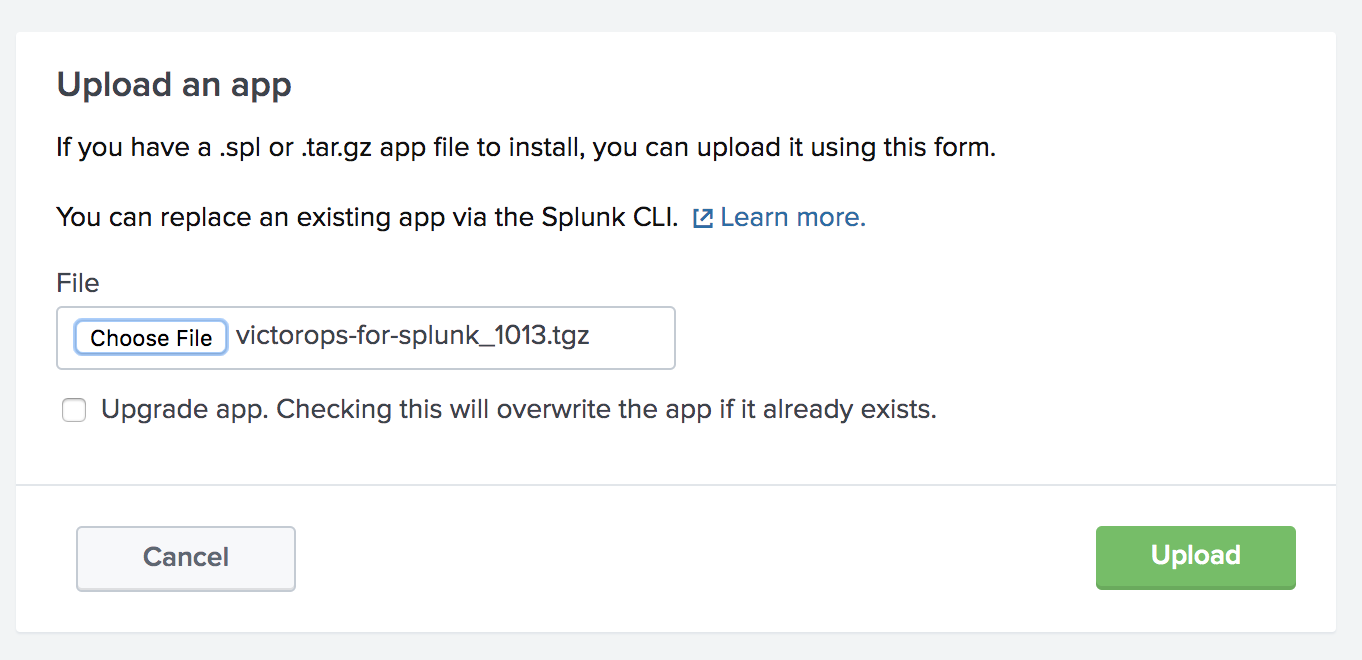
Splunkを起動し、ブラウザで Web UIを開きます。上部のナビゲーションバーからメニューを展開し、Manage Apps を選択します。次に、Install app from file を選択します。

先ほどダウンロードしたSplunk On-Call for Splunkアプリの.tgzファイルを選択し、Upgrade app をチェックして、アプリケーションが最新バージョンに更新されていることを確認します。次に、Upload を選択し、Splunkを再起動してプロセスを終了します。
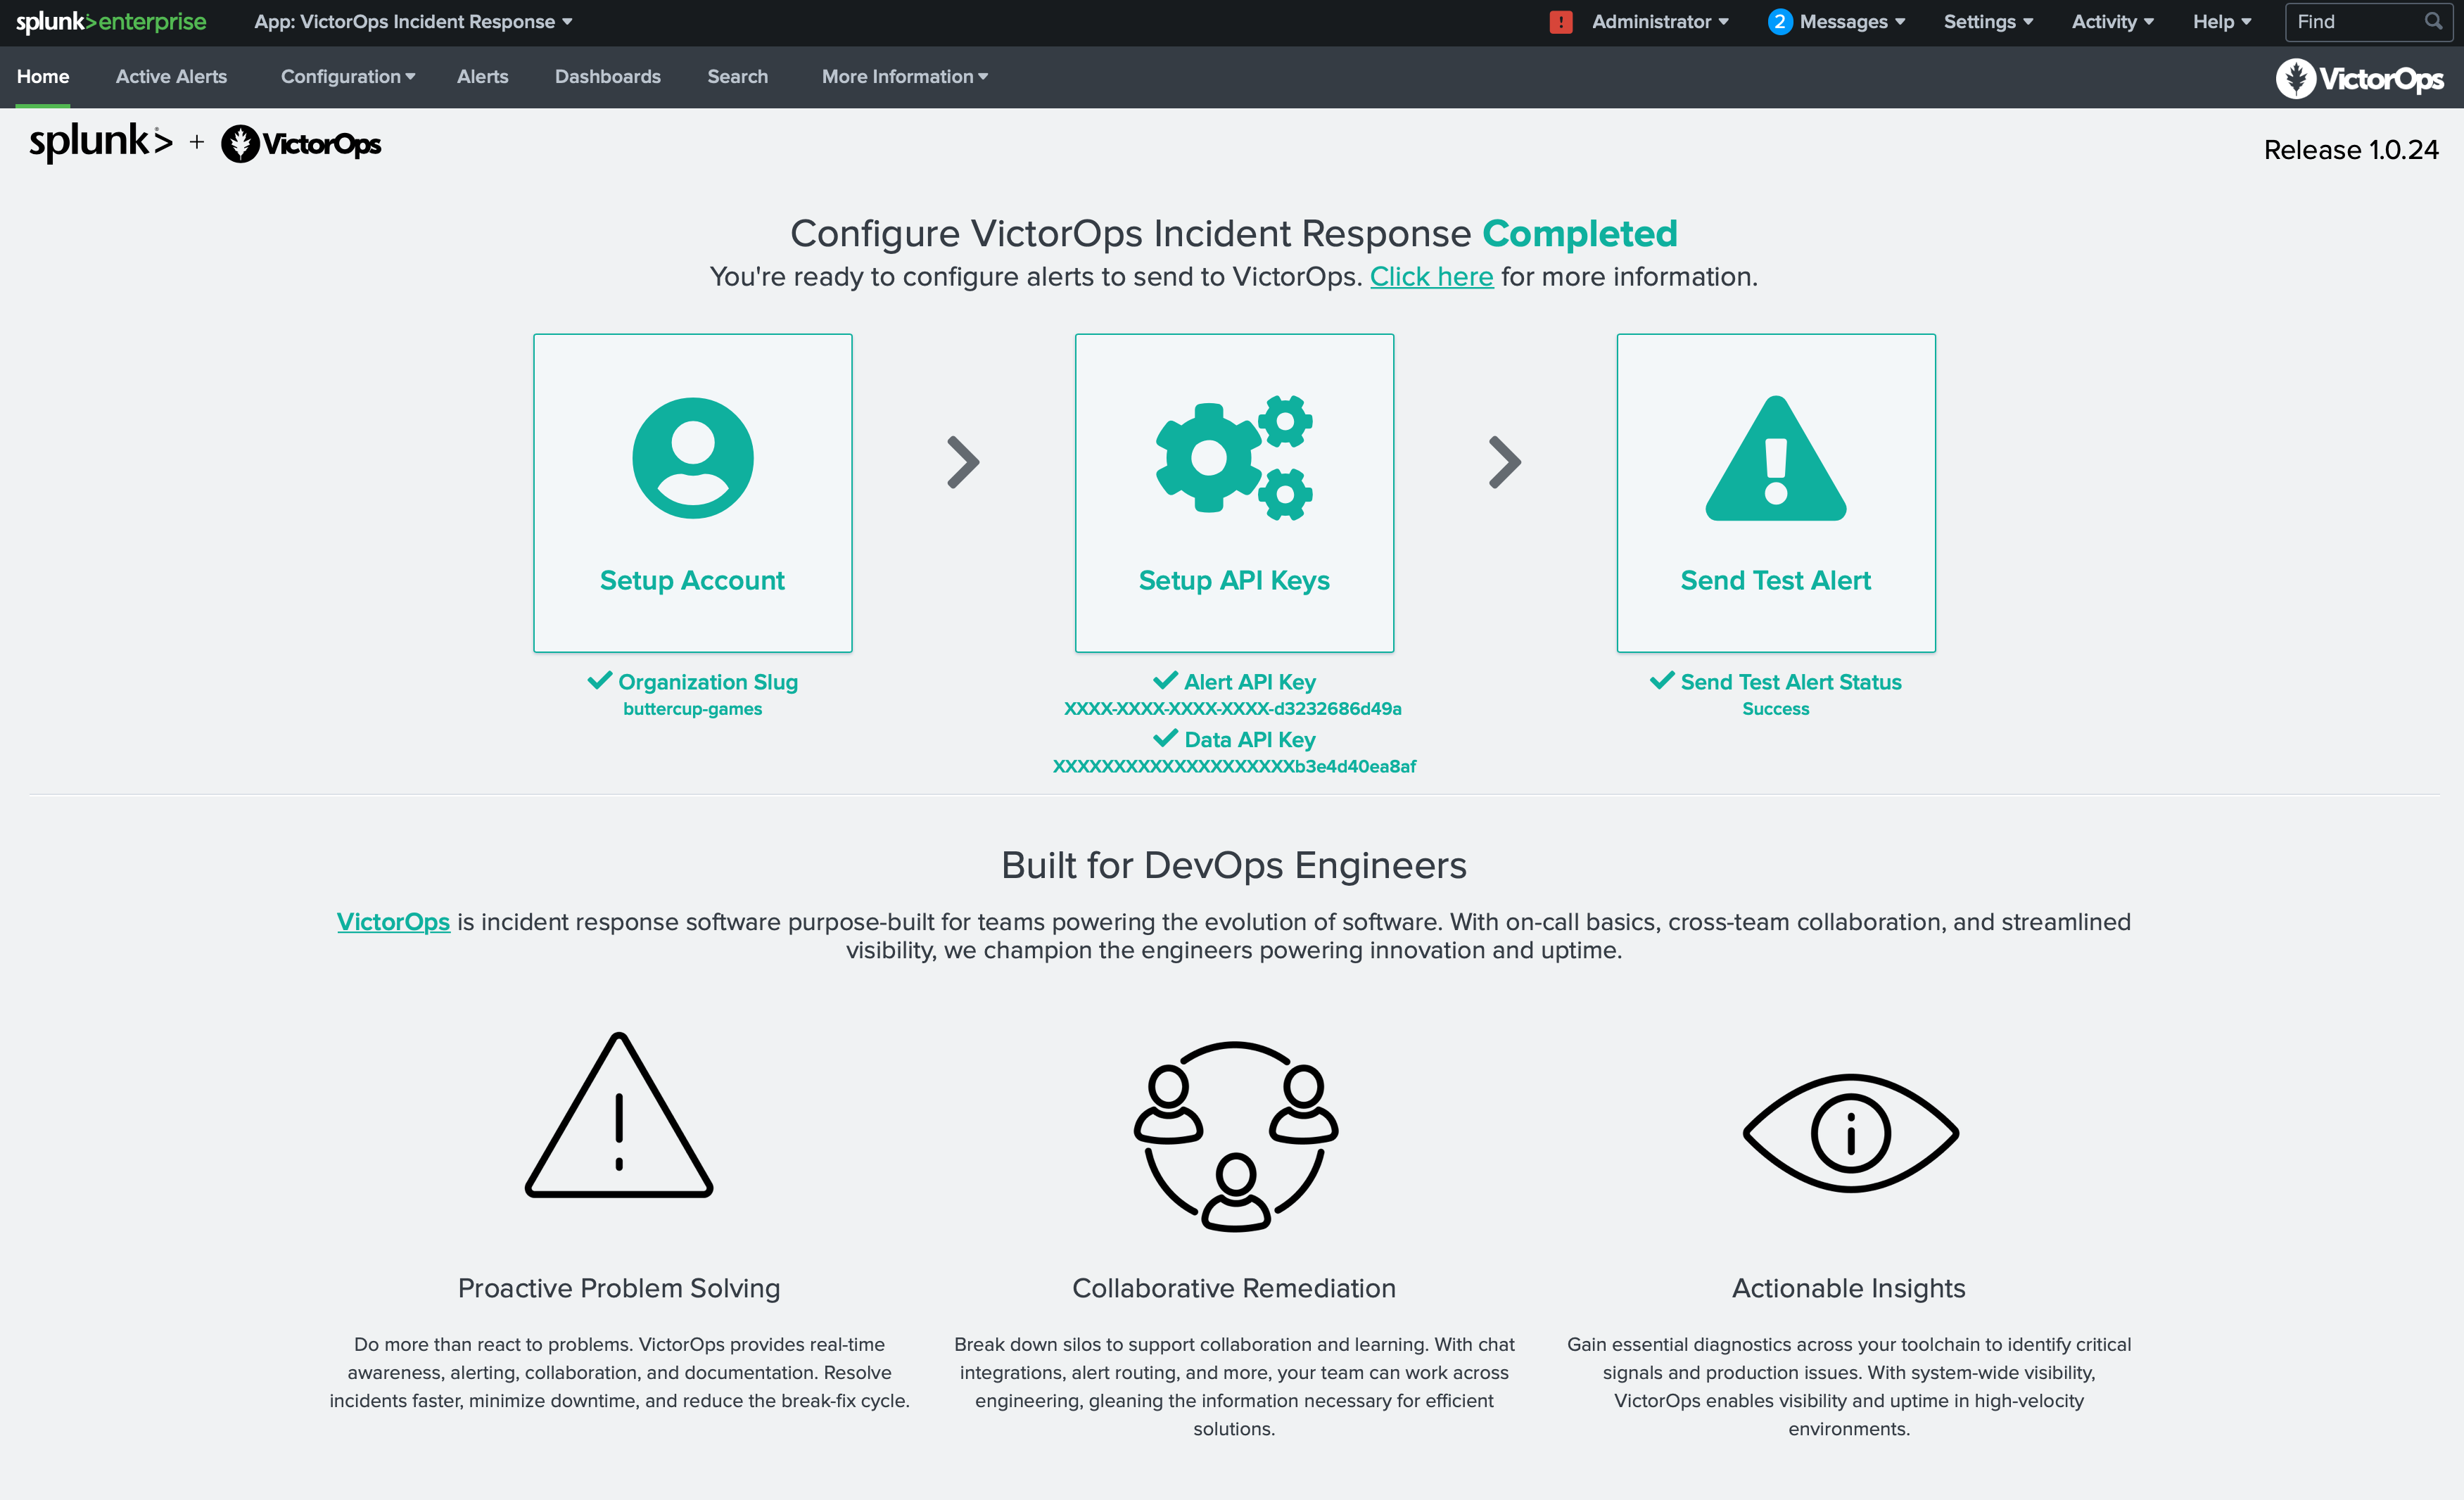
Splunkが再起動したら、Manage Apps ページに戻り、Splunk On-Call Incident Managementアプリの横にある Launch App を選択します。Splunk On-Callインシデント対応ホームページで設定を続行します。
アラートAPIキーの設定 🔗
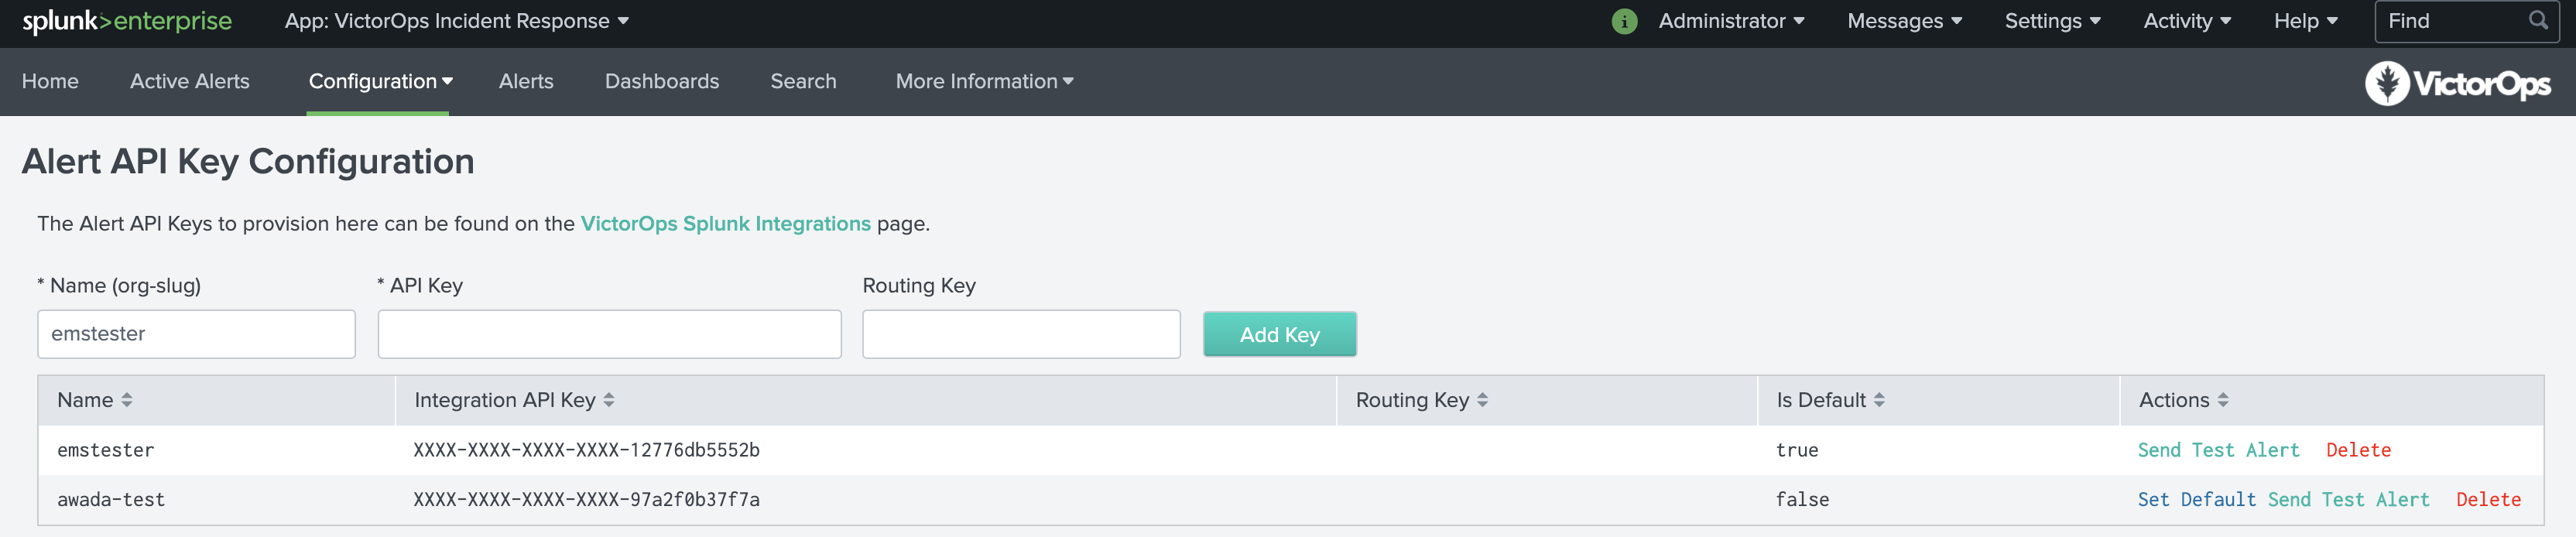
Alert API Key Configurationページで、先ほどコピーしたAPIキーと、Splunk On-Call組織から必要なルーティングキーを貼り付けます。ルーティングキーが空の場合、アラートはデフォルトのルーティングキーにルーティングされます。Splunk On-Call Splunk Integration リンクからAPIキーにアクセスすることもできます。
テスト設定 🔗
APIが保存された後、アクションの下で Test を選択することで、インテグレーションを検証することができます。このテストアラートは組織内のインシデントではなく、INFO アラートとして記録されます。このテストアラートを見つけるには、インシデントタブではなくタイムラインを見てください。または、Splunkの検索アプリから次のように入力します:
| sendalert victorops param.message_type=“INFO”
これにより、テストアラートがSplunk On-Callタイムラインに直接送信されます。インシデントを作成するには、INFO を CRITICAL に変更します。
データAPIの設定とルーティングキー 🔗
バージョン1.0.21以降では、Splunk On-Call内の Integrations、API にあるSplunk On-Call API IDとAPIキーを追加して、Splunk On-Call内でルーティングキーを取得することができます。APIキーとIDをまだ生成していない場合は、アクティベートして組織キーとIDを生成してください。
APIキーとAPI IDが保存されたら、Retrieve Routing Keys を選択し、組織のルーティングキーの最新リストを取得します。
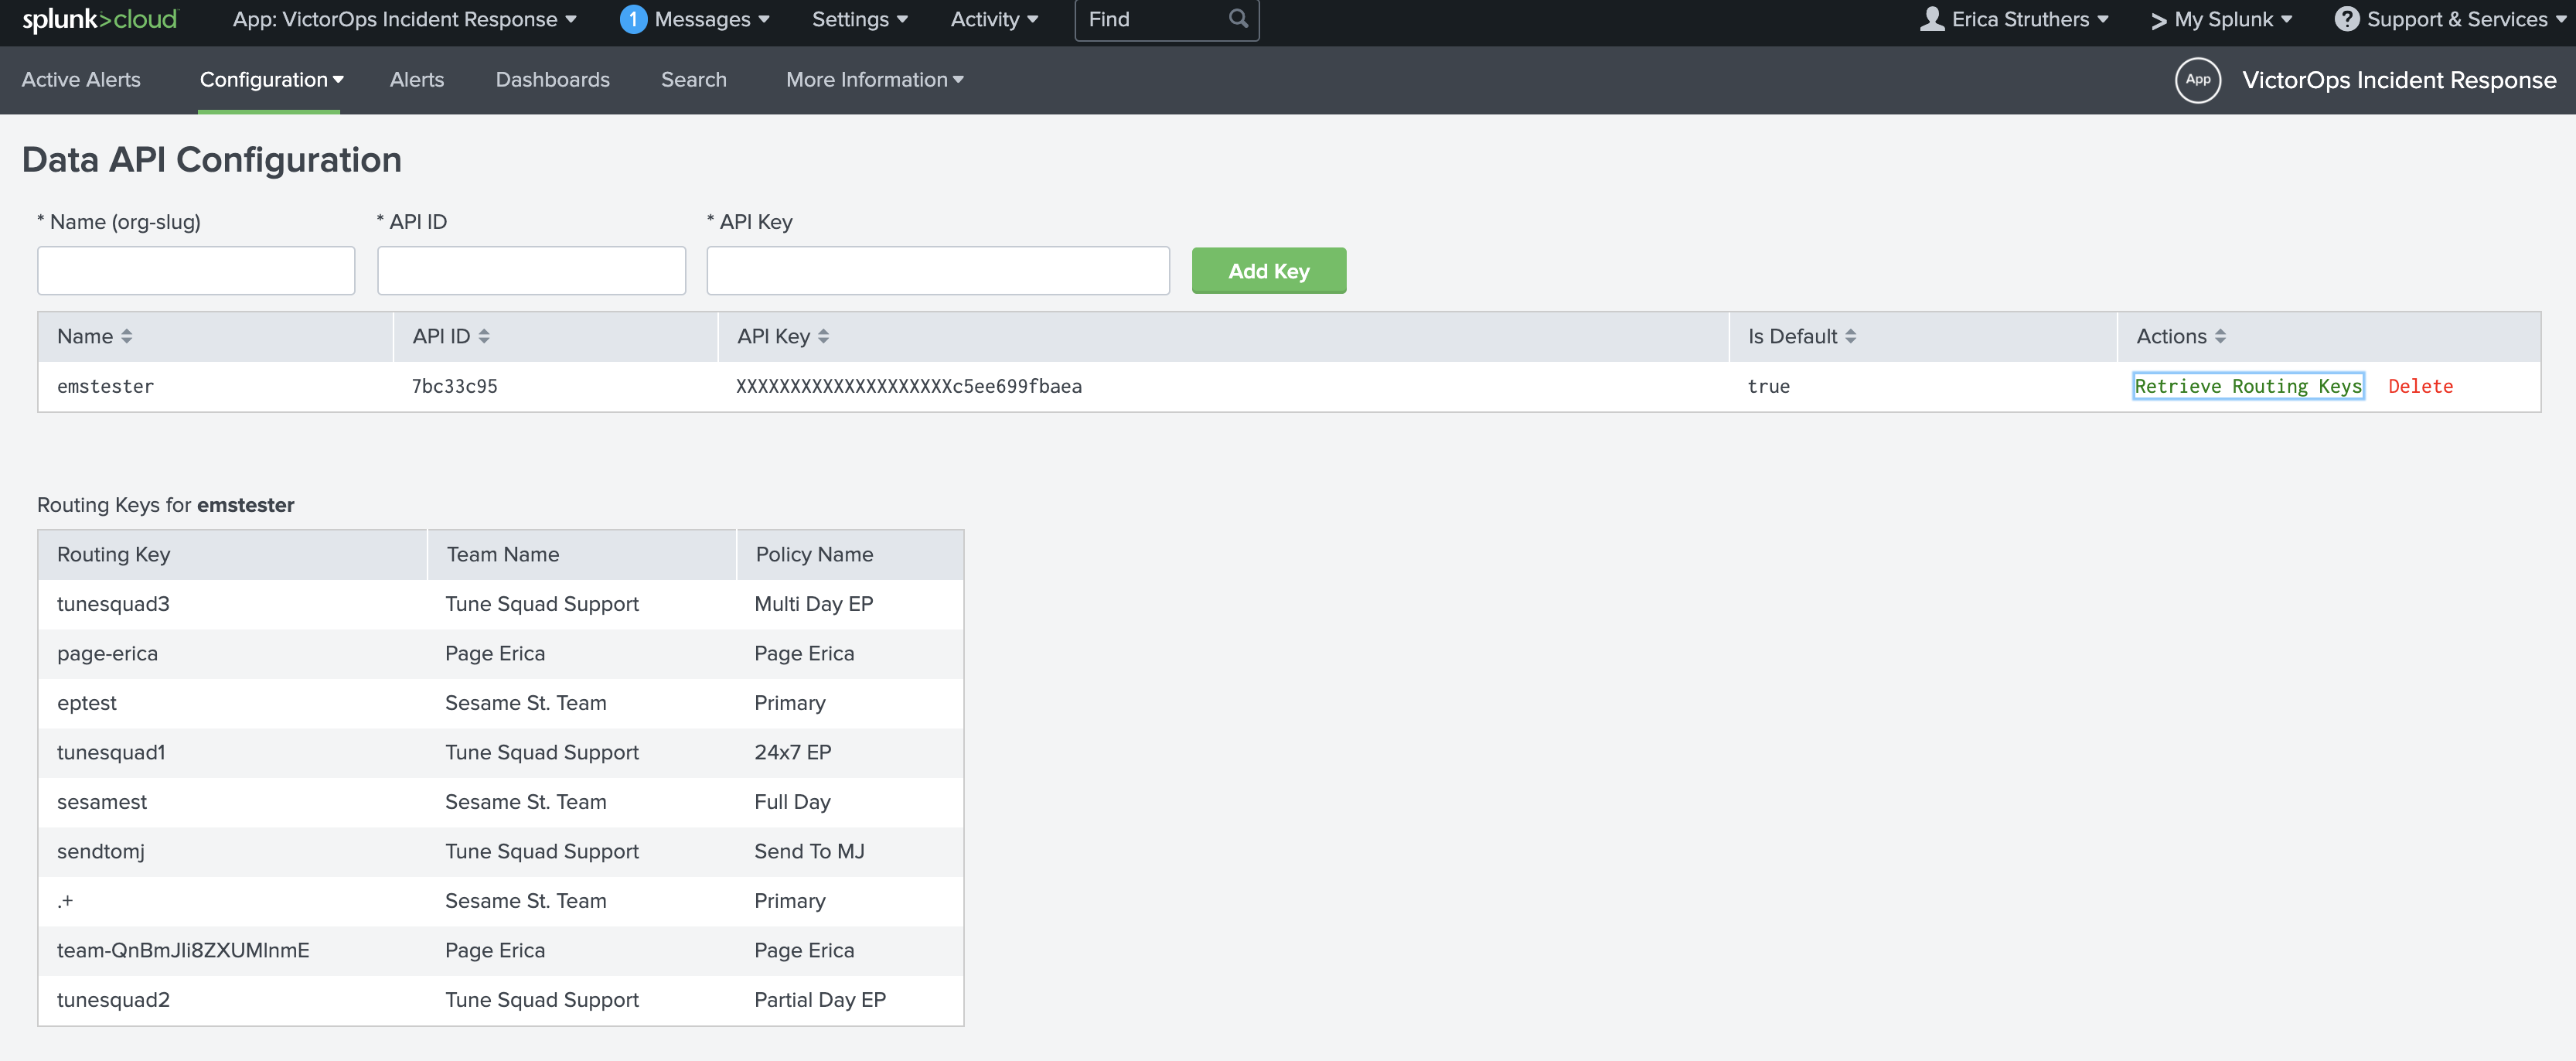
Splunk On-Callアラートアクションを作成すると、Splunk On-Call組織内のすべてのルーティングキーのメニューが表示されます。
Splunk On-Callアラートアクションを設定する 🔗
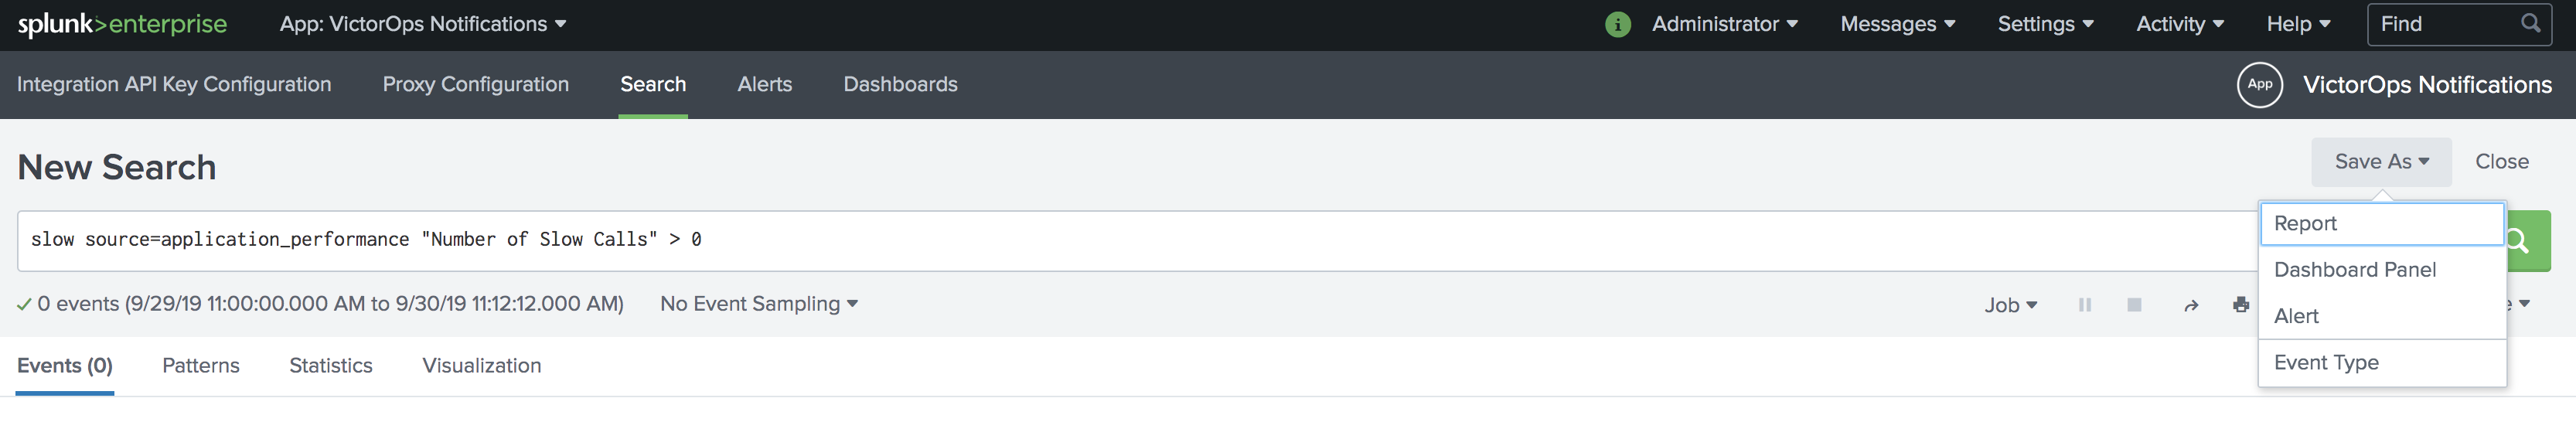
以下は、検索に基づく新しいアラートの例です。新しい検索から、Save As を選択し、次に Alert を選択します。
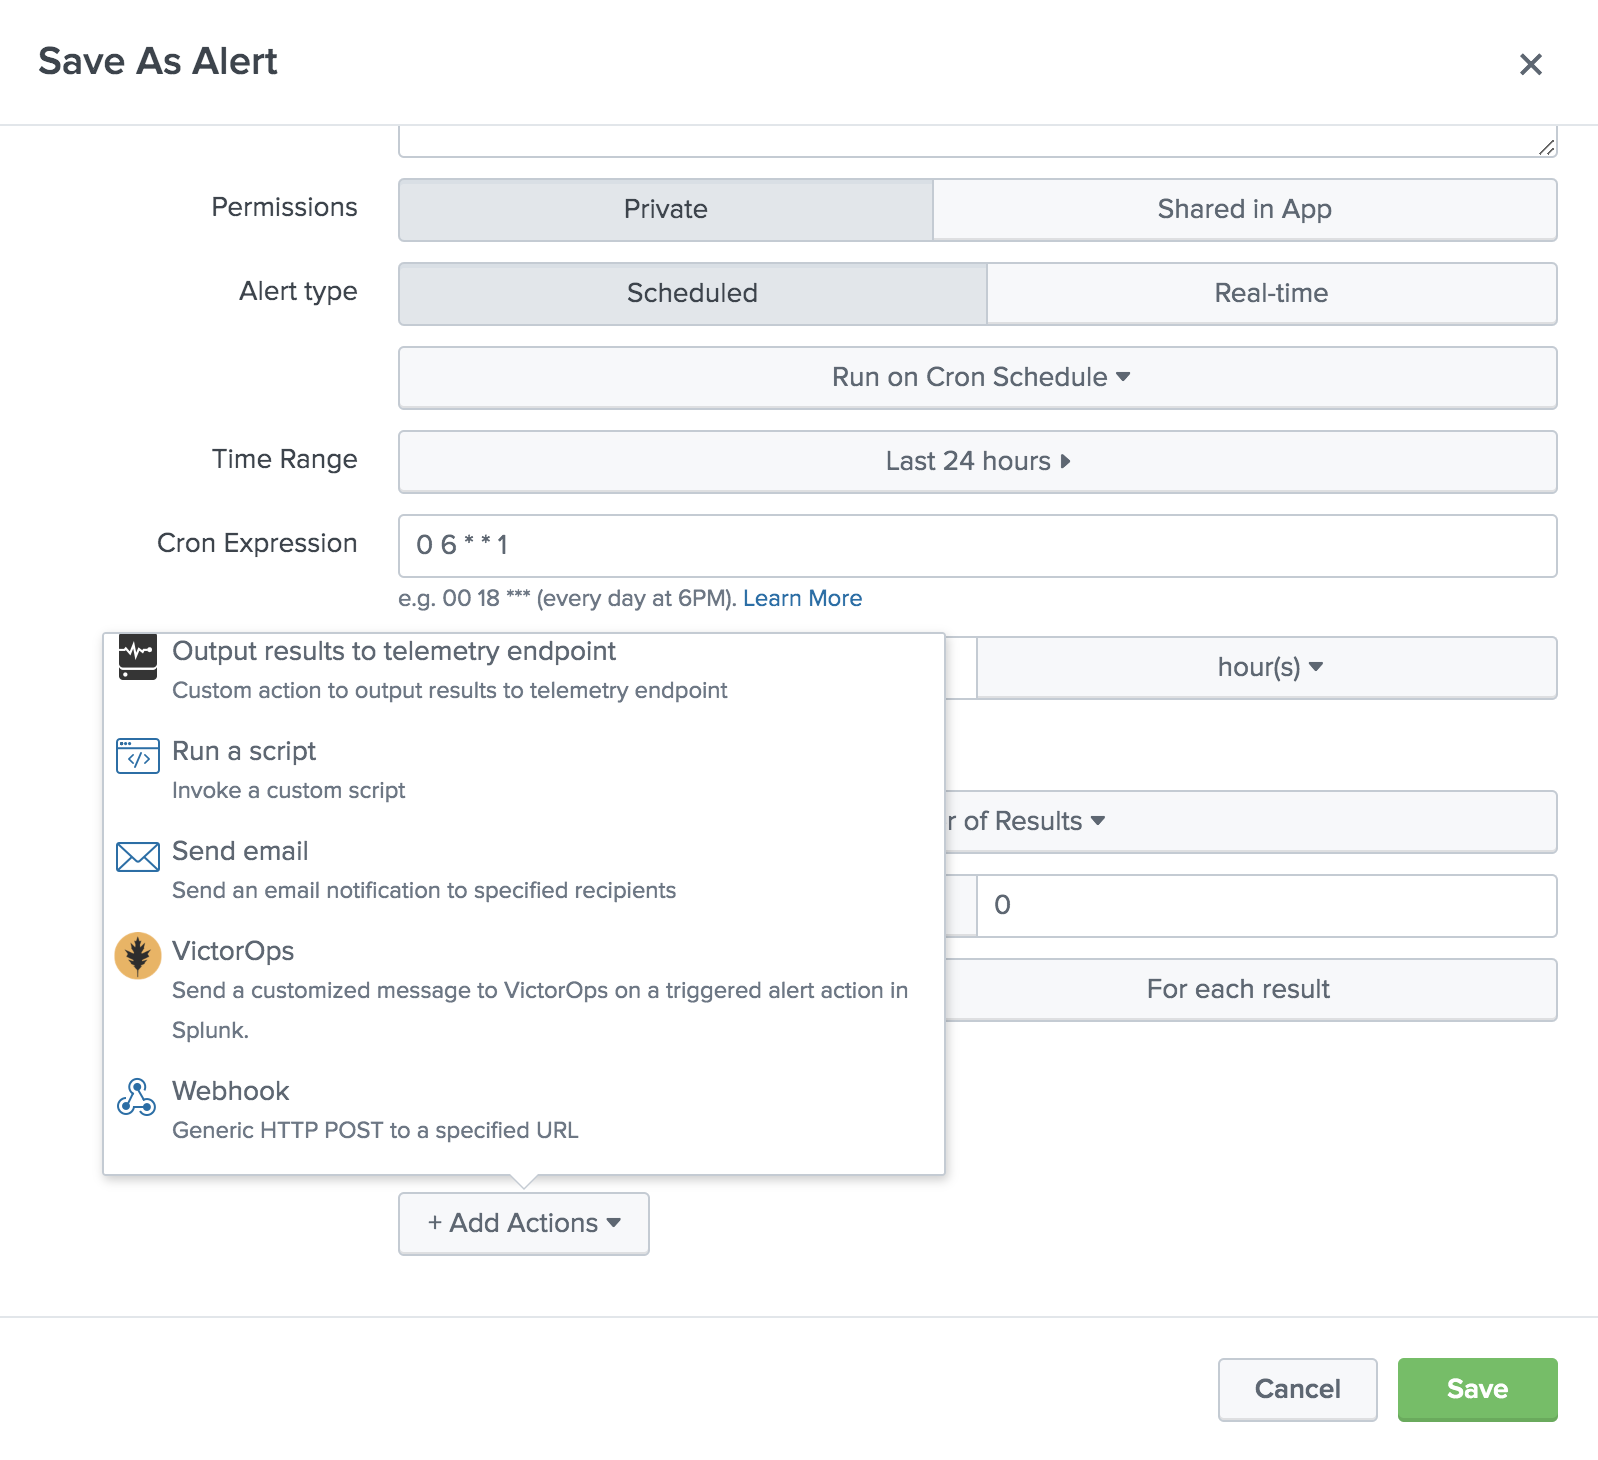
アラートにタイトル、説明、アクセス許可、スケジュールを設定します。+ Add Actions で、Splunk On-Call を選択します。
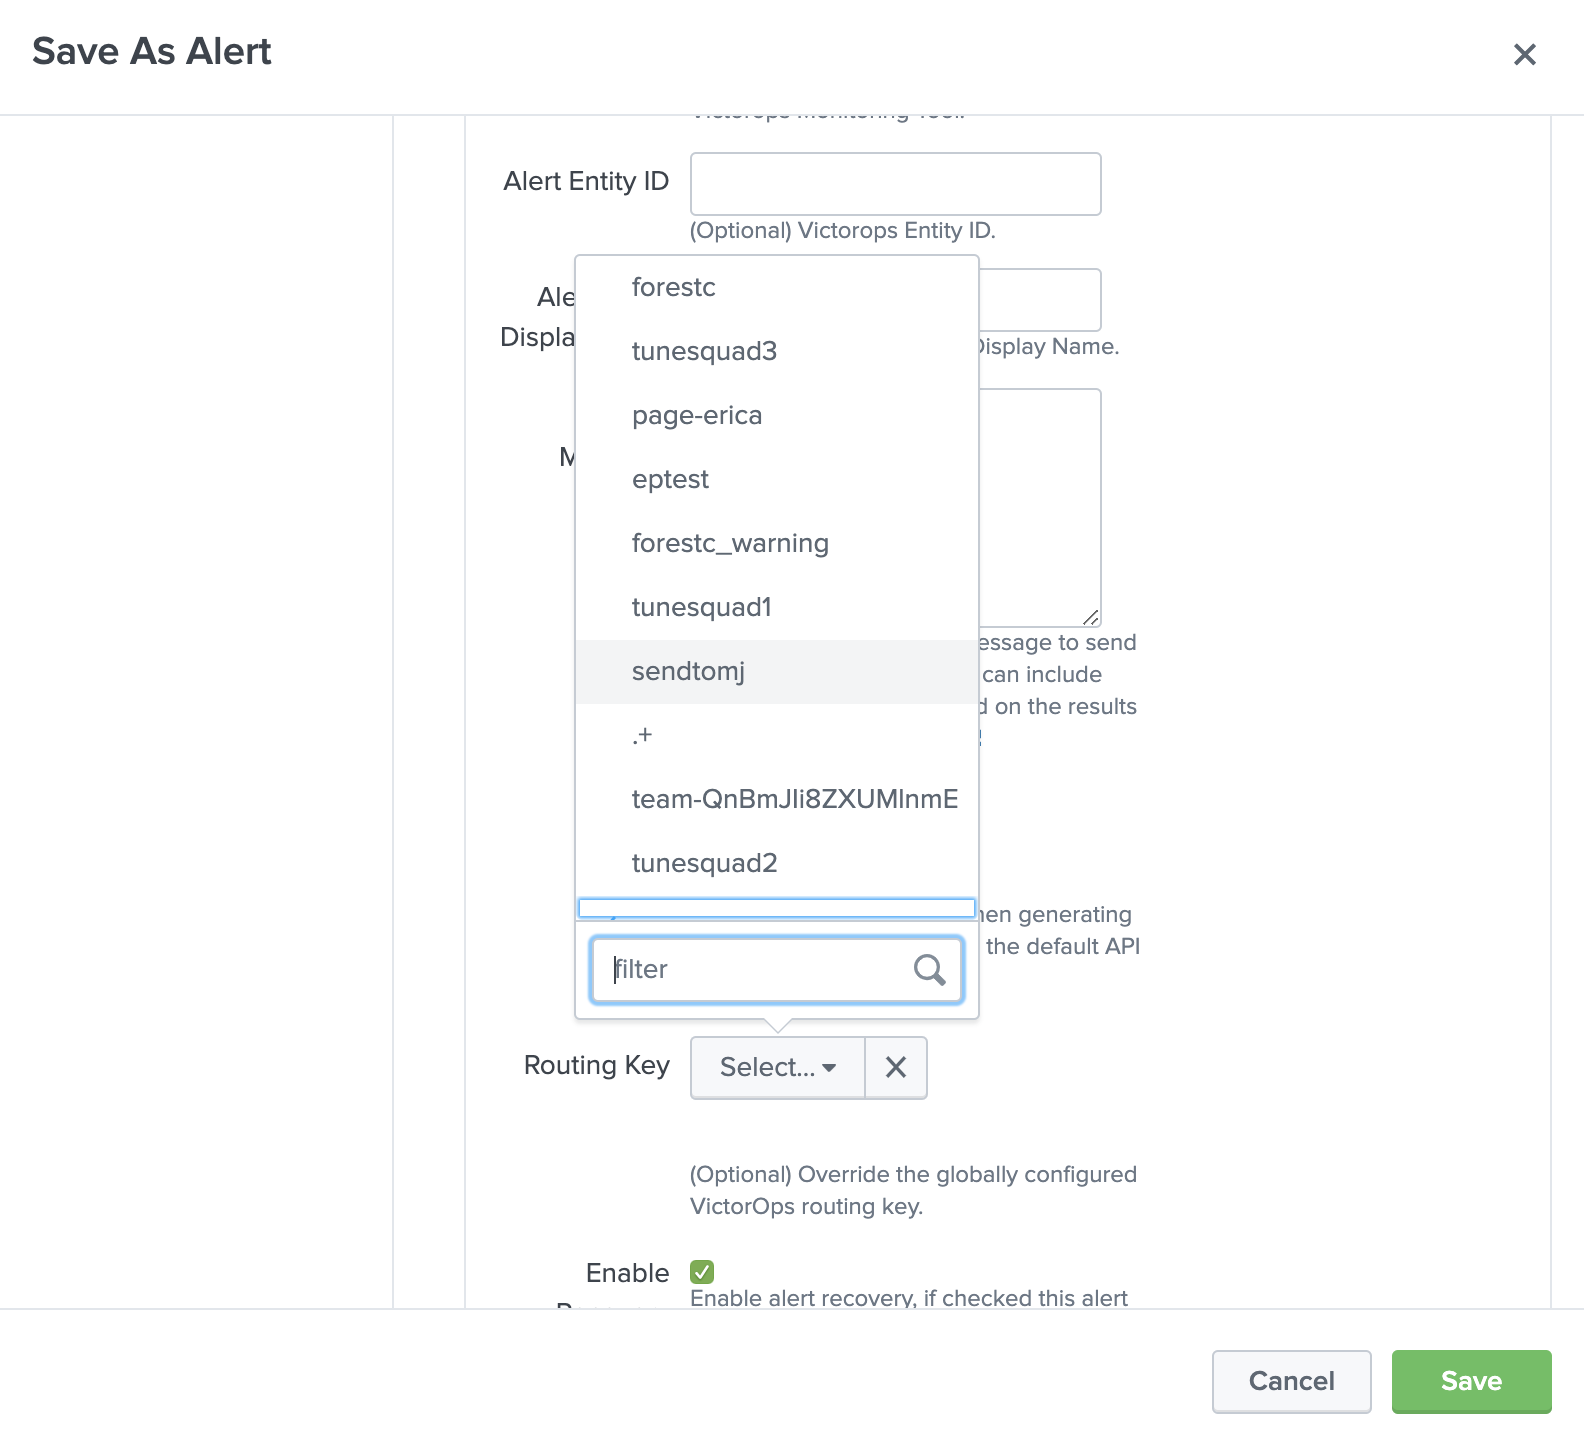
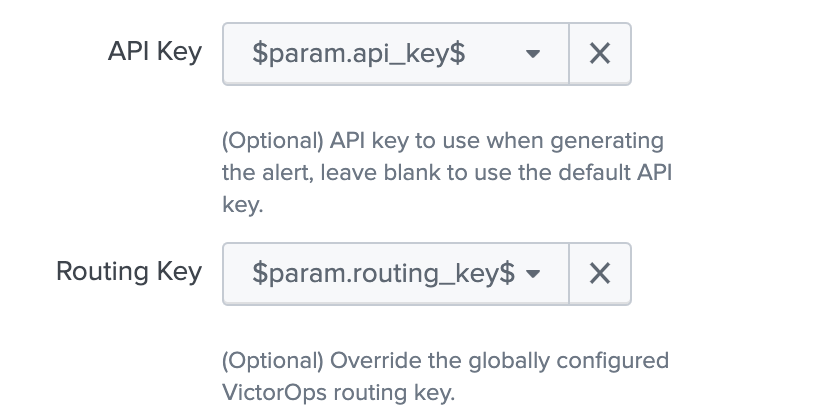
必要なメッセージタイプを選択し、状態メッセージフィールドを使用して、この特定のアラートが示す簡単な説明を追加します。必要に応じて、entity_id のデフォルト値を上書きすることができます。APIキーまたはルーティングキーが選択されていない場合、アラートはこれらのフィールドのデフォルト値に送信されます。さらに、トークンを使用してこれらの割り当て内でSplunkフィールドを動的に参照することもできます。

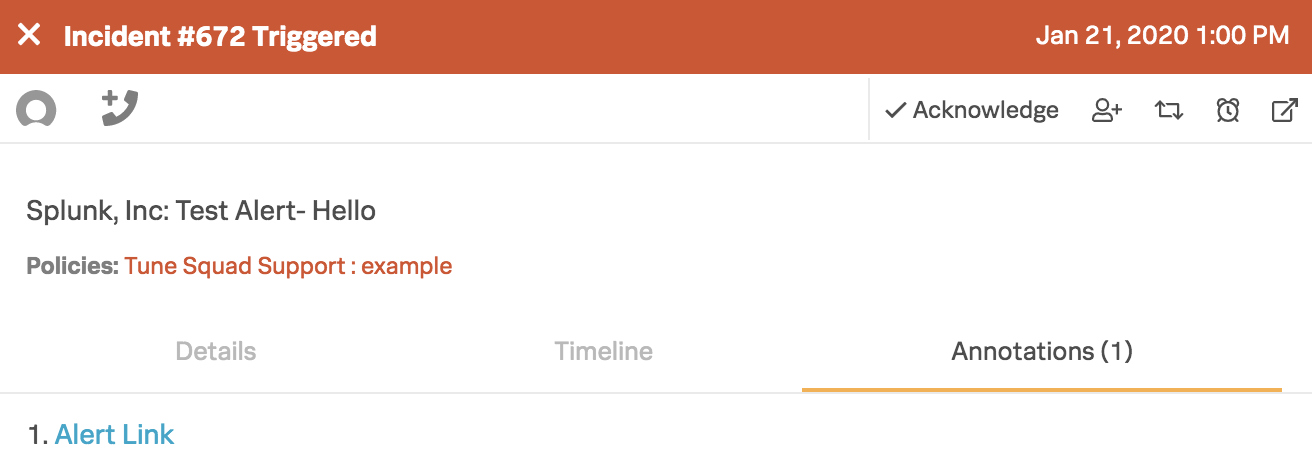
指定した条件が満たされると、Splunk On-Callタイムラインにアラートが表示されます。
アラートの注釈 🔗
Splunk On-Callでは、インシデントの「注釈」タブの下に、すべてのSplunkアラートにはSplunkアラートに戻るためのアラートリンクが含まれています。
その他のインシデント注釈を追加するには、Splunk On-Callアラートルールエンジン を参照してください。
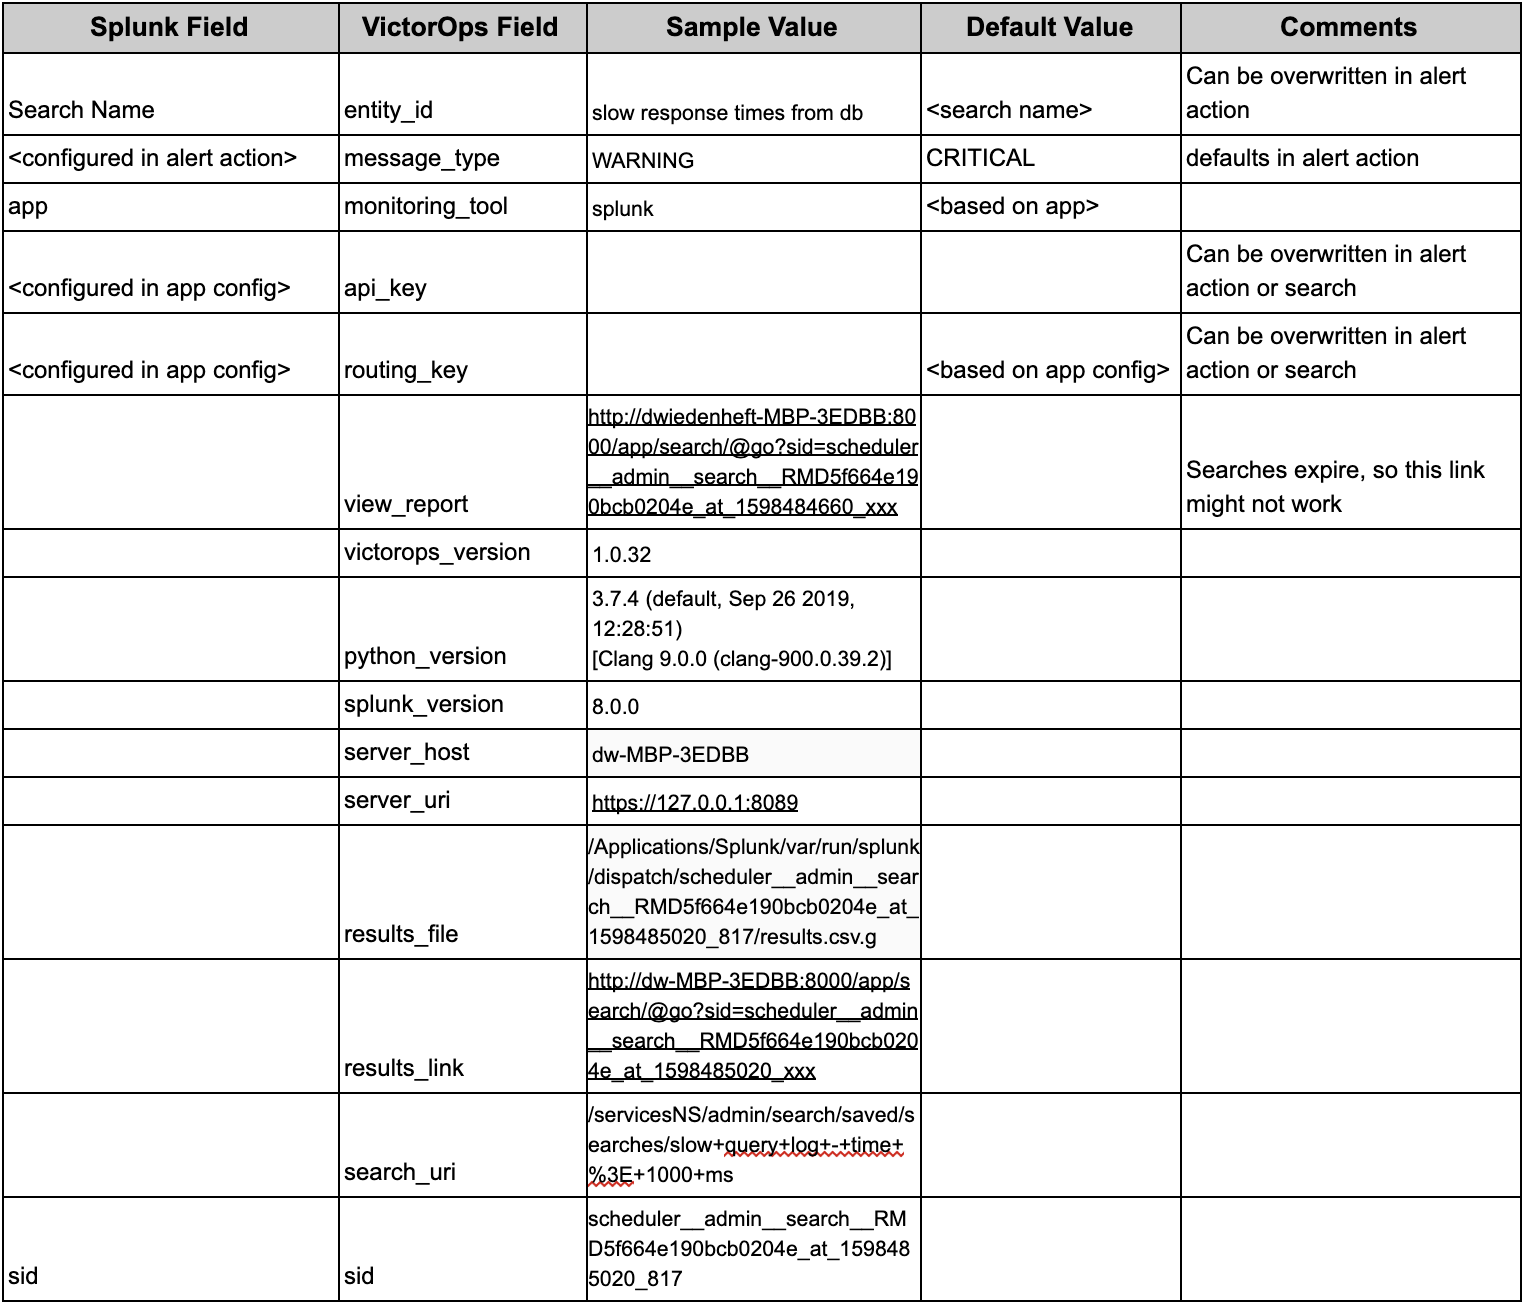
SplunkおよびSplunk On-Callのマップされたフィールド 🔗
次の表は、マッピングされたSplunkおよびSplunk On-Callフィールドを示しています:
Splunk Cloud Platformを設定する 🔗
In Splunk On-Call 🔗
Splunk On-Call Webポータルから、Integrations、3rd Party Integrations、Splunk Enterprise に移動し、Enable Integration を選択します。後の手順で使用するため、APIキーをクリップボードにコピーします。
In Splunk Cloud Platform 🔗
Apps で Find More Apps を選択し、検索バーで Splunk On-Call:guilabel: と入力します。Install を選択します。アプリがインストールされると、 Apps の下に表示されます。
アプリを開くと、Splunk On-Callインシデント対応ホームページが表示され、アカウントの設定、APIキーの設定、アラートのテストが案内されます。設定が完了すると、各設定ステップの横にチェックマークが表示されます。
アラートAPIキーの設定 🔗
アラートAPIキー設定ページで、先ほどコピーしたAPIキーと、Splunk On-Call組織から必要なルーティングキーを貼り付けます。ルーティングキーが空白の場合、アラートはデフォルトのルーティングキーにルーティングされます。また、Splunk On-Call Splunk Integration を選択してAPIキーにアクセスすることもできます。
データAPIの設定とルーティングキー 🔗
バージョン1.0.21以降では、Splunk On-Call内の Integrations、API にあるSplunk On-Call API IDとAPIキーを追加して、Splunk On-Call内でルーティングキーを取得することができます。APIキーとIDをまだ生成していない場合は、アクティベートして組織キーとIDを生成してください。
APIキーとAPI IDを保存したら、Retrieve Routing Keys を選択し、組織のルーティングキーの最新リストを取得します。
Splunk On-Callアラートアクションを作成すると、Splunk On-Call組織内のすべてのルーティングキーを含むメニューが表示されます。
設定をテストする 🔗
APIが保存された後、アクションの下で Test を選択することで、インテグレーションを検証することができます。このテストアラートは、INFO アラートとして記録されているため、組織内のインシデントではありません。テストアラートを見つけるには、Incidents タブではなく、タイムラインを見てください。または、Splunkの検索アプリから次のように入力します:
| sendalert victorops param.message_type=“INFO”
インシデントを作成するには、INFO を CRITICAL に変更します。
Splunk On-Callアラートアクションの設定 🔗
以下は、検索に基づいて新しいアラートを設定する例です。新しい検索から Save As を選択し、次に Alert を選択します。
アラートにタイトル、説明、アクセス許可を与え、チェックスケジュールを設定します。:guilabel:` + Add Actions` で、Splunk On-Call を選択します。
必要なメッセージタイプを選択し、状態メッセージフィールドを使用して、この特定のアラートが示す簡単な説明を追加します。必要に応じて、entity_id のデフォルト値を上書きすることができます。APIキーまたはルーティングキーが選択されていない場合、アラートはこれらのフィールドのデフォルト値に送信されます。さらに、トークンを使用してこれらの割り当て内でSplunkフィールドを参照することができます。
指定した条件が満たされると、Splunk On-Callタイムラインにアラートが表示されます。
アラートの注釈 🔗
Splunk On-Callでは、インシデントの Annotations タブの下に、すべてのSplunkアラートにはSplunkアラートに戻るためのアラートリンクが含まれています。
その他のインシデント注釈を追加するには、Splunk On-Callアラートルールエンジン を参照してください。
高度な設定 🔗
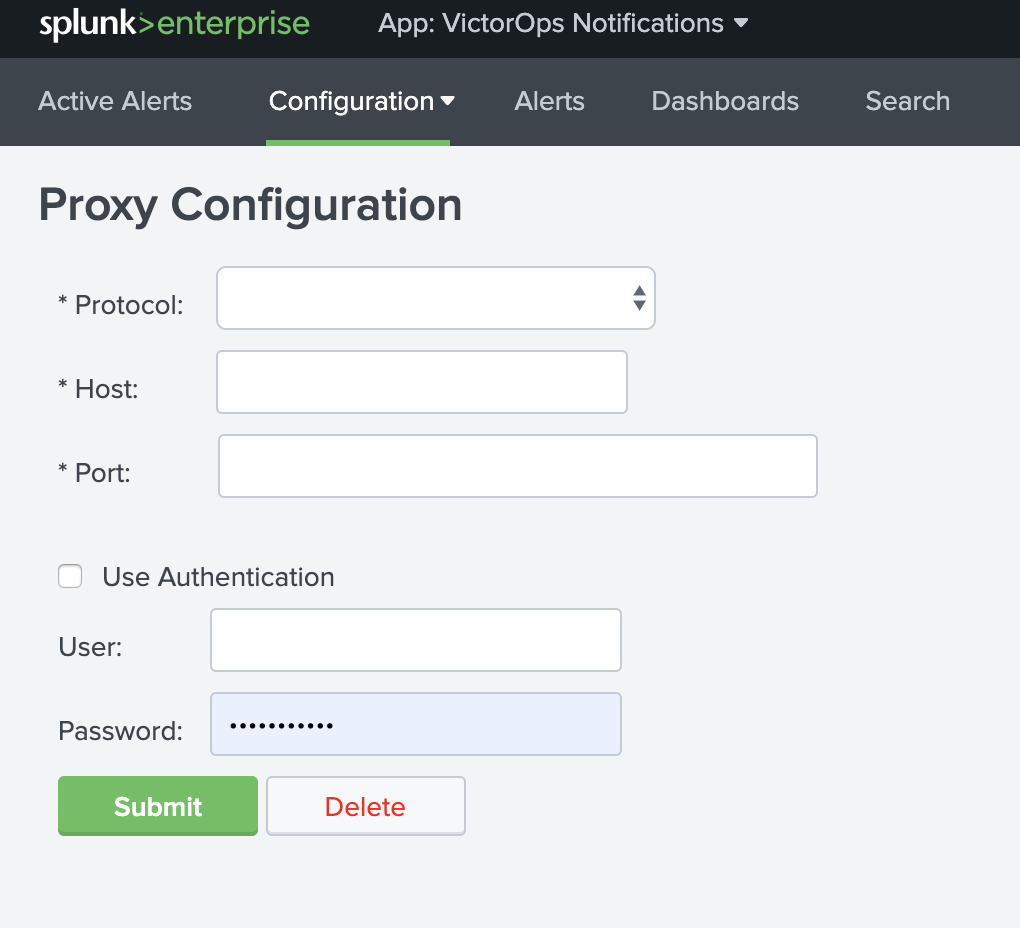
プロキシ設定 🔗
プロキシ設定は、Configuration. Proxy Configuration に移動して、インテグレーションに対して有効にできます。
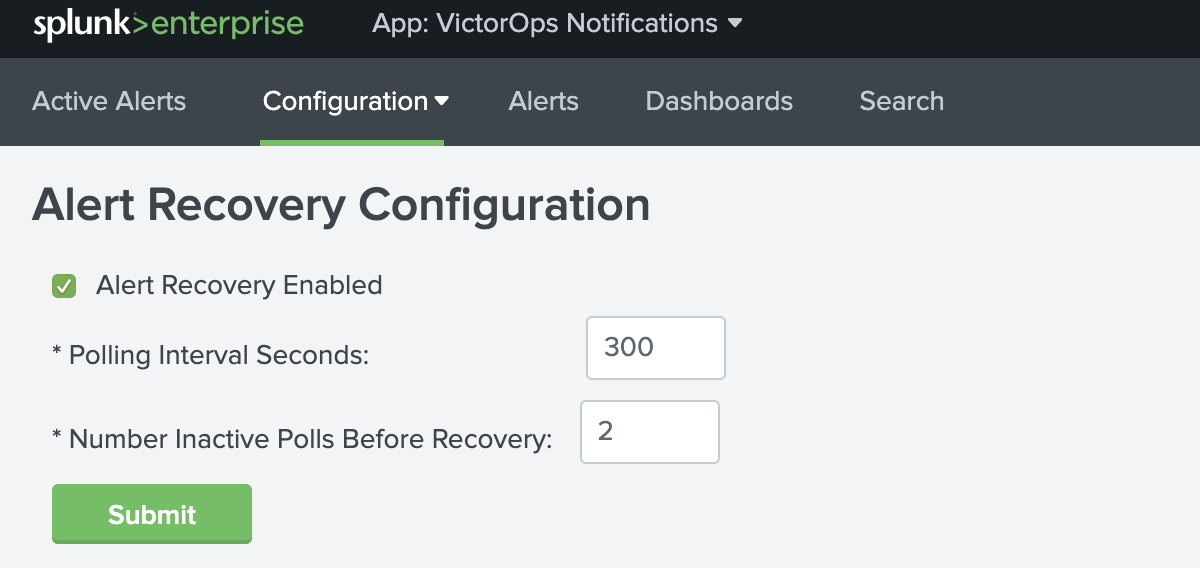
アラートリカバリ設定 🔗
Splunk for Splunk On-Callアプリが有効化されると(1.0.18以降)、アラートリカバリチェックボックスはデフォルトでグローバルに ON に設定されます。アラートリカバリチェックボックスは、個々のアラートレベルでより細かく設定することもできます。
グローバルリカバリ設定では、ポーリング間隔(秒)と、リカバリ送信前の非アクティブポーリング数を設定できます。以下は、アラートリカバリのグローバルデフォルト設定です:
個々のアラートレベルでは、Splunk On-Call Trigger Actionsの下に、より詳細な設定のための Enable Recovery チェックボックスがあります。バージョン1.0.25以降では、個々のアラートごとにポーリング間隔と非アクティブなポーリング回数を設定できます。
注釈
アラート固有のリカバリ設定は、グローバルリカバリ設定よりも大きくなければなりません。
検索を使用してAPIキーとルーティングキーを動的に設定する 🔗
バージョン1.0.25以降では、検索でAPIキーとルーティングキーを設定できます。
以下は、動的な値に必要なフォーマットの例です。
<alert search> | eval 'param.api_key'="xxxxxxxxxx" | eval 'param.routing_key'="xxx"
検索から動的に値を取得してSplunk On-Callトリガーアクションを作成する場合、パラメータ api_key をアラートのAPI キーとして選択し、param.routing_key をアラートのルーティングキーとして選択します。
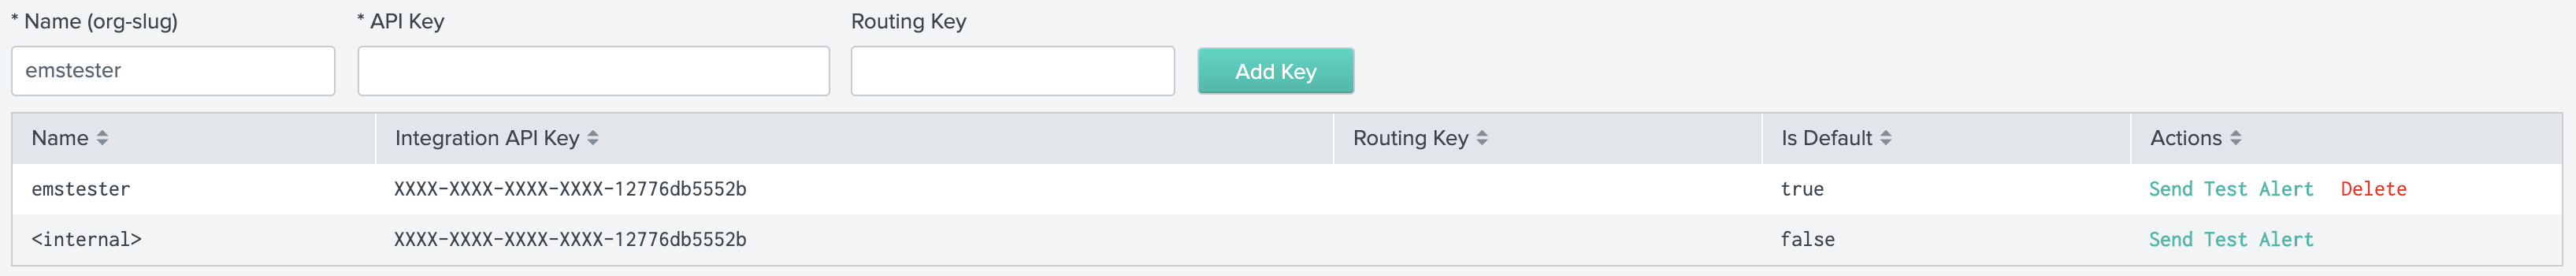
検索で使用される動的キーは、アラートAPIキー設定のキーとして追加されます。
サーチヘッドクラスターのセットアップ 🔗
検索ヘッドを使用してSplunk for Splunk On-Callを実行する前に、Deployerと少なくとも3つの検索ヘッドがあることを確認してください。
以下は、Splunk for Splunk On-Callアプリを検索ヘッドクラスターで使用する場合の手順です。
UIを使用して、DeployerにSplunk for Splunk On-Callアプリの最新バージョンをインストールします。
./bin/splunk apply shcluster-bundle -target `https://sh1:8089 <https://sh1:8089/>`__ -auth username:passwordを実行してサーチヘッドに押し出します。1つの検索ヘッドにインテグレーションAPIキーを設定します。
インテグレーションAPIキーは自動的に他のサーチヘッドノードにレプリケートされます。
各サーチヘッドをテストして確認します。
Splunk ITSI 🔗
Splunk On-CallとSplunk ITSIのインテグレーションにより、Splunkのデータとログ分析機能を活用して、複数のインシデントを 1つのイベントグループに関連付け、Splunk On-Callに簡単にアラートを送信できます。その後、チームメイトはSplunk On-Callのタイムライン内で監視データと連携し、インシデント対応と修復を迅速化できます。
このインテグレーションガイドに従うには、Splunk ITSI 4.0以上が必要です。
In Splunk On-Call (ITSI) 🔗
Splunk On-Call Webポータルから、Integrations、3rd Party Integrations、Splunk ITSI に移動し、Enable Integration を選択します。後の手順で使用するため、APIキーをクリップボードにコピーします。
Splunk ITSIの注目すべきイベント集約ポリシー 🔗
Configure、Notable Events Aggregation Policies に移動し、Splunk On-Callに警告を発したい集約ポリシーの名前を選択します。
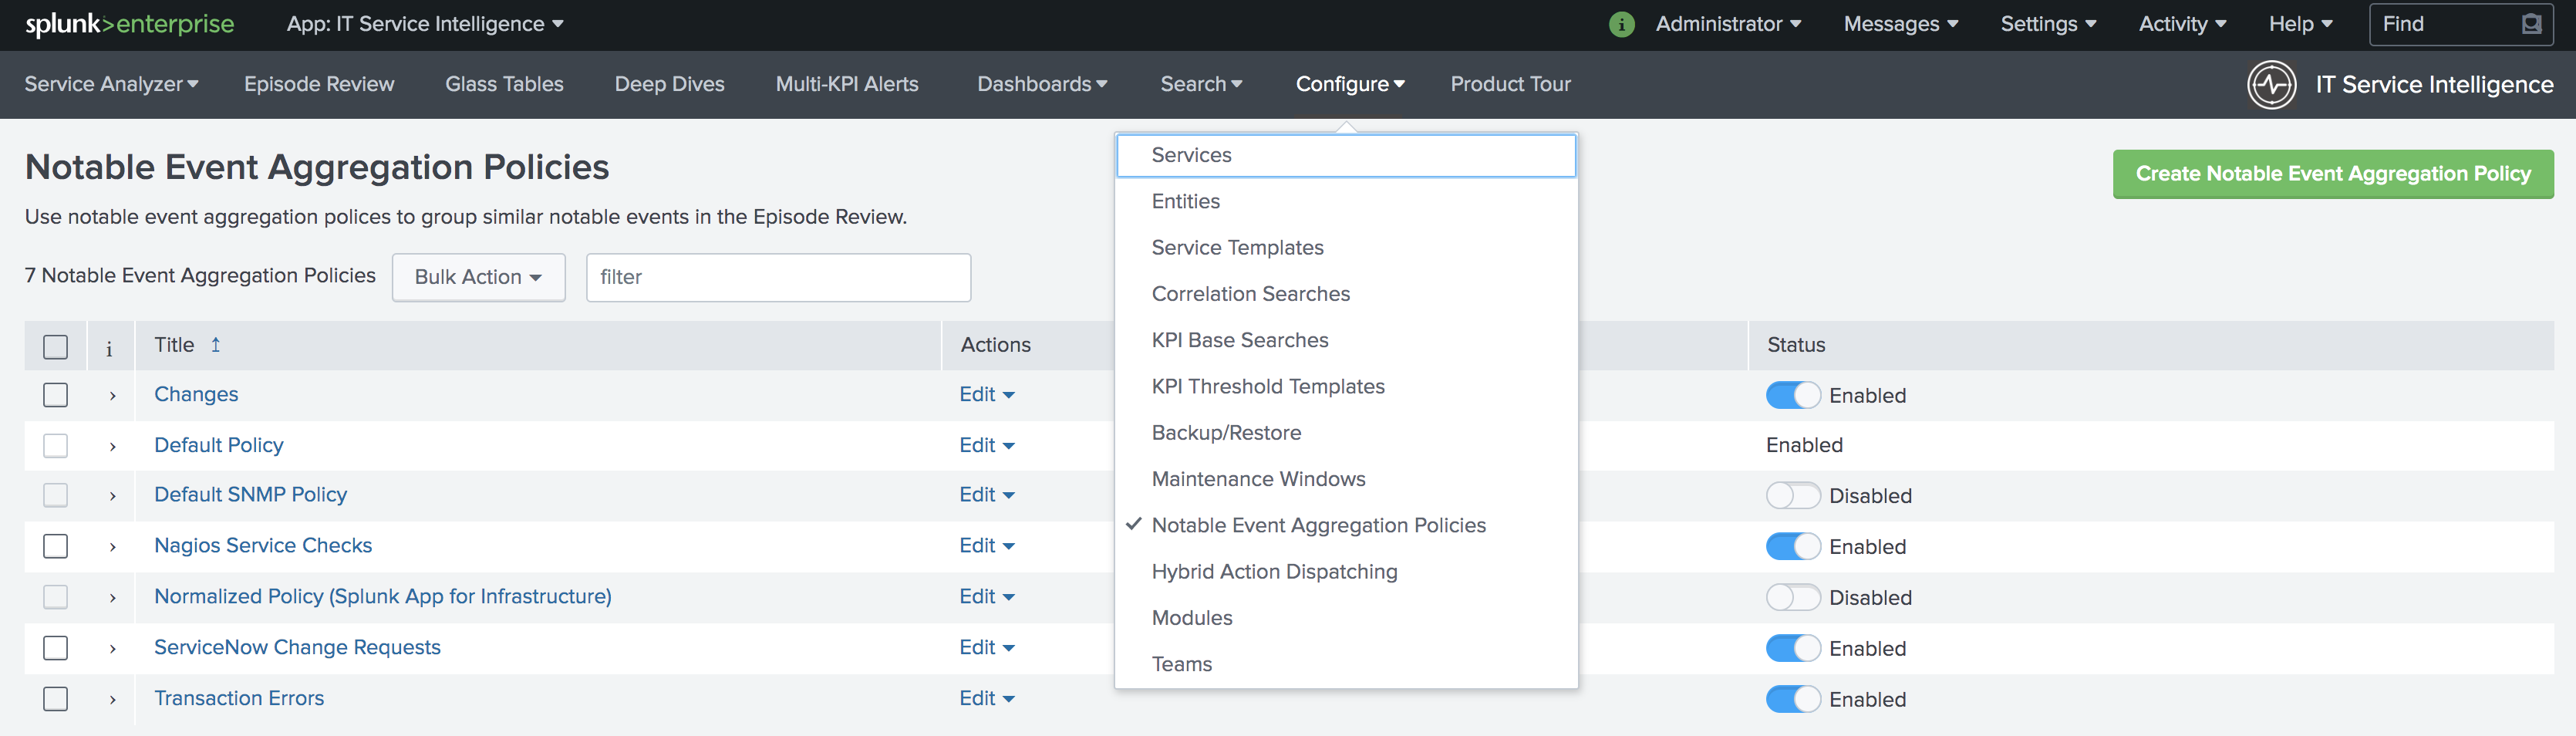
Action Rules タブで、トリガー条件を設定し、Splunk On-Call を選択して、それに従ってアラートを設定します。
アラートエンティティIDは、関連するアクションのすべてのメッセージタイプで一貫性を保ちます(デフォルトは空白のまま)。Splunk On-Callはこのフィールドを使用してインシデントを識別し、後続のアラートを元のインシデントと関連付けます。正しく設定されると、ITSIは自動的にSplunk On-Callインシデントを作成します。
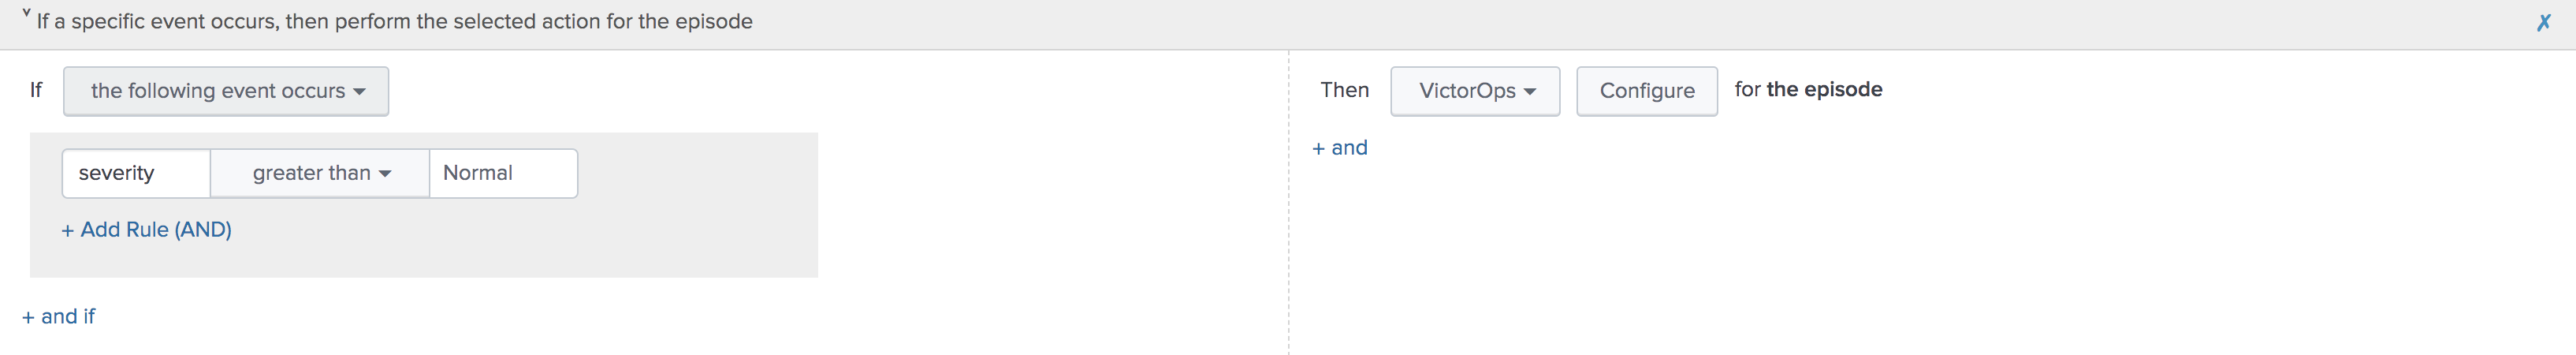
Splunk On-Callインシデントを作成する 🔗
目的の集約ポリシーの Action Rules タブに移動します。Splunk On-Callでインシデントを作成するアクションでは、条件を if the following event occurs: severity greater than Normal に設定し、Splunk On-Call と Configure を選択します。
設定が必要なフィールドは、モニタリングツールフィールドとメッセージタイプだけです。残りのフィールドはデフォルト値を使用します。デフォルト値は以下の通りです:
メッセージタイプ:
CRITICAL(この値を設定する)モニタリングツール:
splunk-itsi(この値を設定する)アラートエンティティID:
$result.itsi_group_idアラートエンティティの表示名:
$result.itsi_group_title状態メッセージ:
$result.itsi_group_titleルーティングキー:デフォルトのルーティングキー(特に指定がない限り)
この機能を使用するには、Splunk On-Call for Splunkアプリで「データAPIキー」と組織名を設定する必要があります。
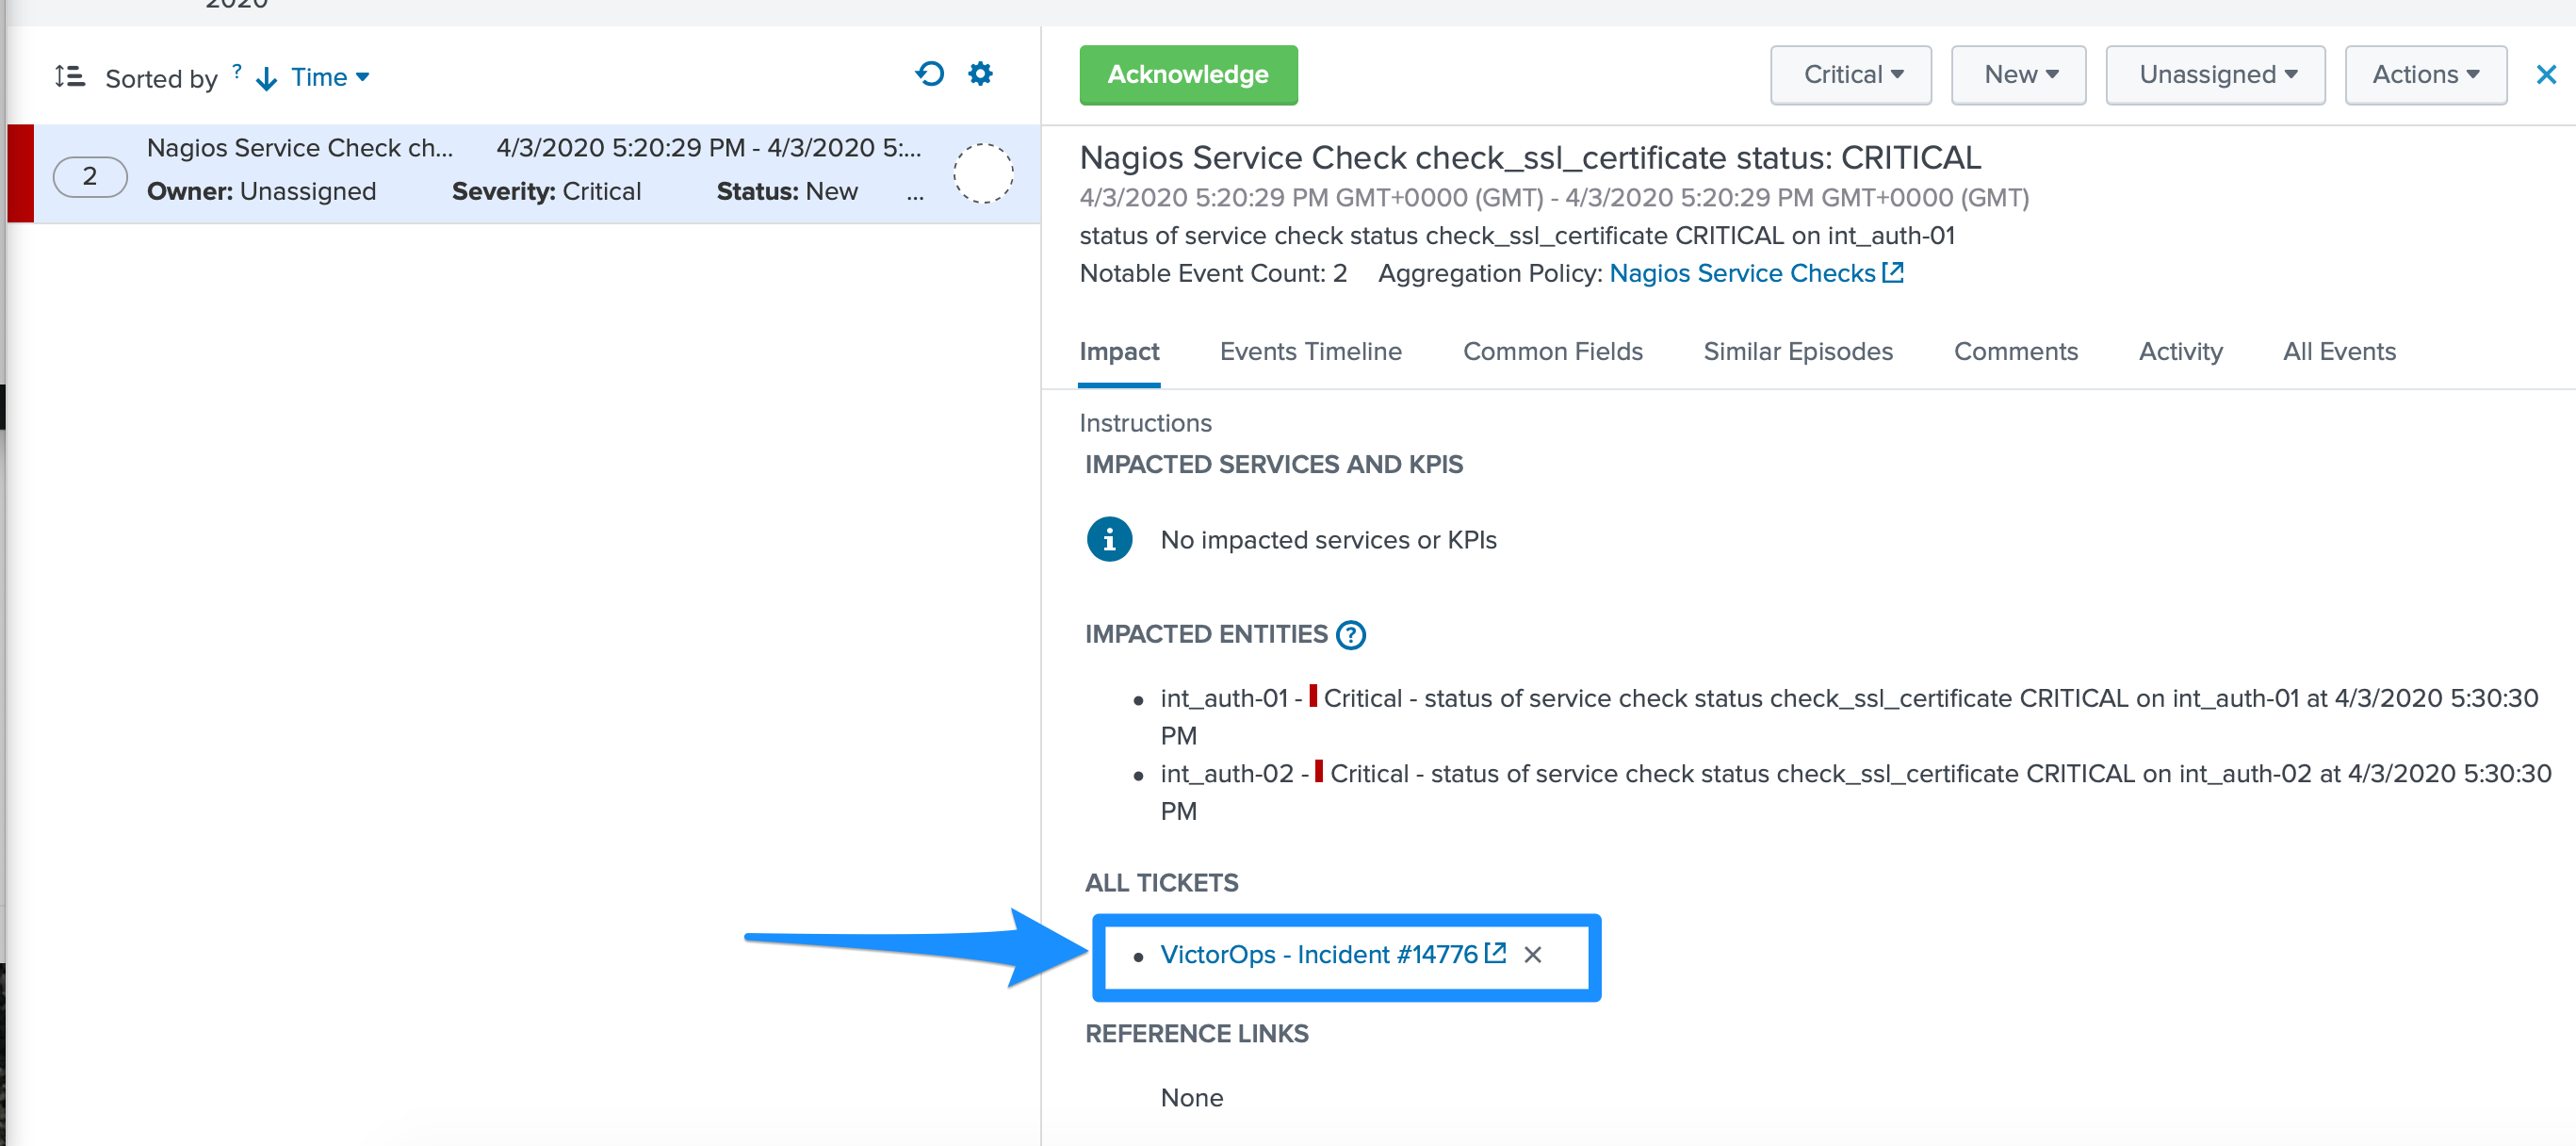
ITSIから: チケットに関連するインシデントがあるかどうかを確認できます。
Splunk On-Callから: この機能により、注釈を通じて、ITSI Filtered Episode ReviewまたはOverall Episode Reviewに簡単にアクセスできるようになります。
Splunk On-Callインシデントを解決するには 🔗
同じ集約ポリシー内で、Action Rules タブに移動します。ITSIでエピソードを解決するには、Change status to Resolved を選択します。Splunk On-Callで対応するインシデントを解決するには、条件を if the episode is broken、次に Splunk On-Call に設定し、Configure を選択します。
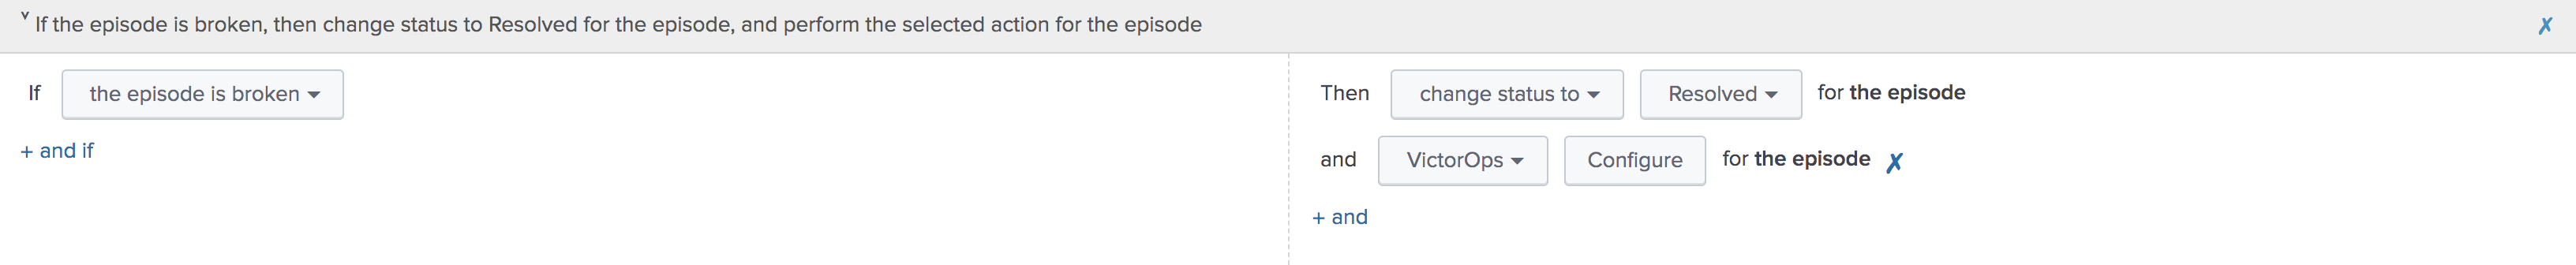
メッセージタイプにRECOVERY、モニタリングツールにITSIを選択してアクションを設定します。アラートエンティティIDは、デフォルト値を使用した場合にSplunk On-Callが対応するインシデントを解決するように、最初のアラートと同じにします。
Splunk On-Callインシデントを手動で確認するには 🔗
Episode Review に移動し、希望のエピソード、Actions を選択し、Splunk On-Call を選択します。
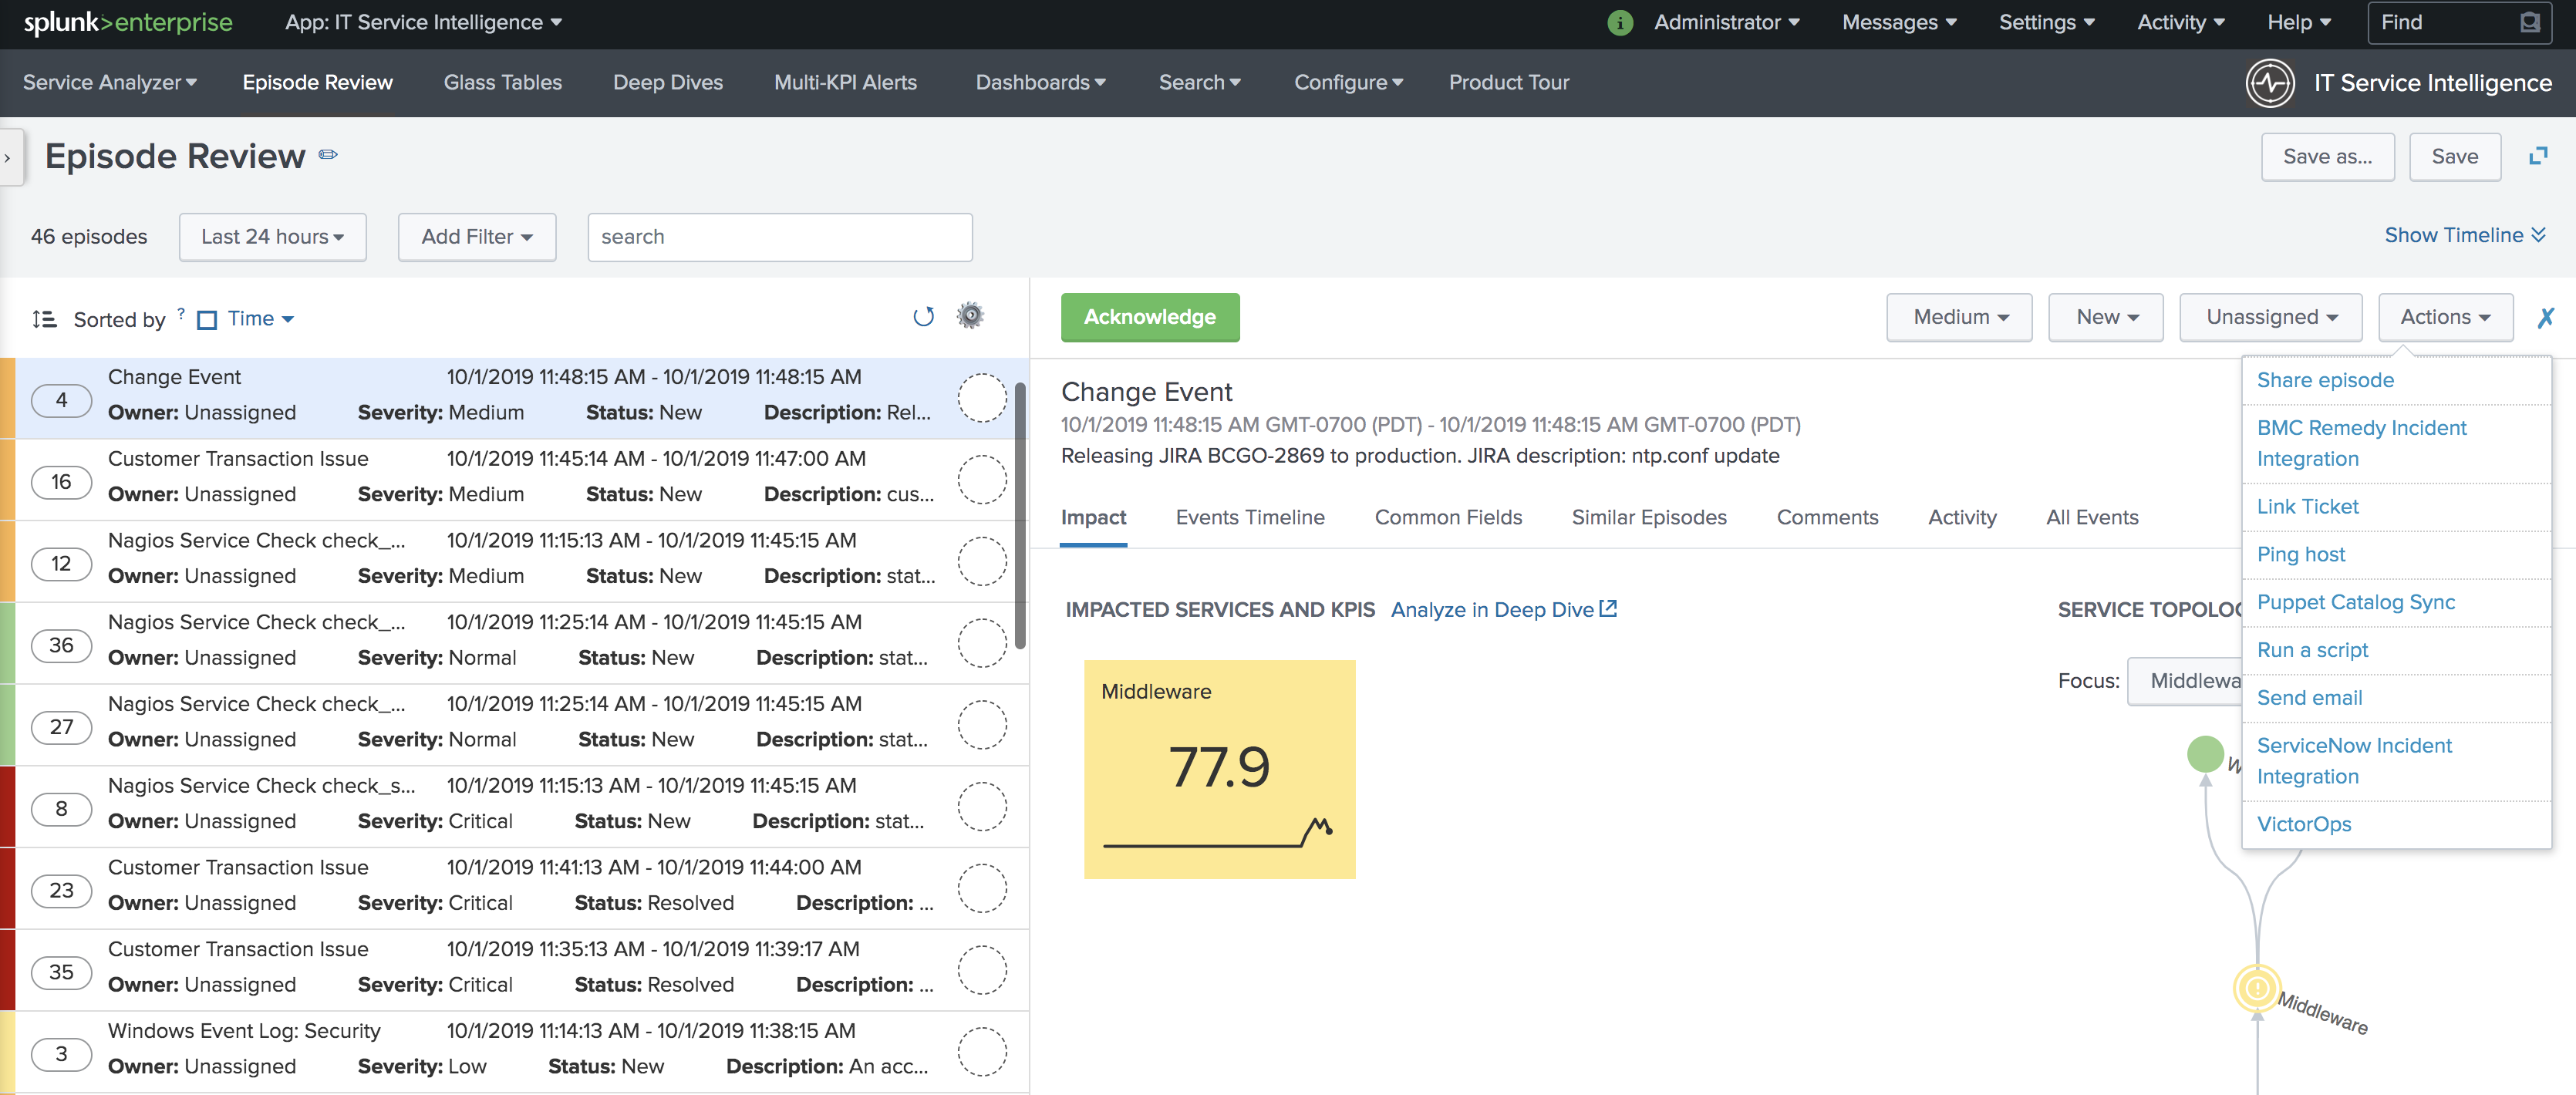
メッセージタイプとして ACKNOWLEDGEMENT を、モニタリングツールとしてITSIを選択してアクションを設定します。その他の値はデフォルトです。アラートエンティティIDは、デフォルト値を使用した場合にSplunk On-Callが対応するインシデントを認識するように、最初のアラートと同じにします。
Splunk SAI 🔗
Splunk SAIを使用すると、膨大なログデータを検索し、インフラストラクチャとアプリケーションの健全性を監視できます。Splunk On-CallとSplunk Insights for Infrastructureのインテグレーションにより、主要な監視メトリクスにアラートのしきい値を設定し、適切なタイミングで適切な担当者にアラートを送信できます。Splunk SAIプラットフォームのシンプルなドロップダウンから、Splunk On-Callに直接アラートを送信するように選択できます。
In Splunk On-Call (SAI) 🔗
Splunk On-Call Webポータルから、Integrations、3rd Party Integrations、Splunk Enterprise に移動し、Enable Integration を選択します。後の手順で使用するため、APIキーをクリップボードにコピーします。
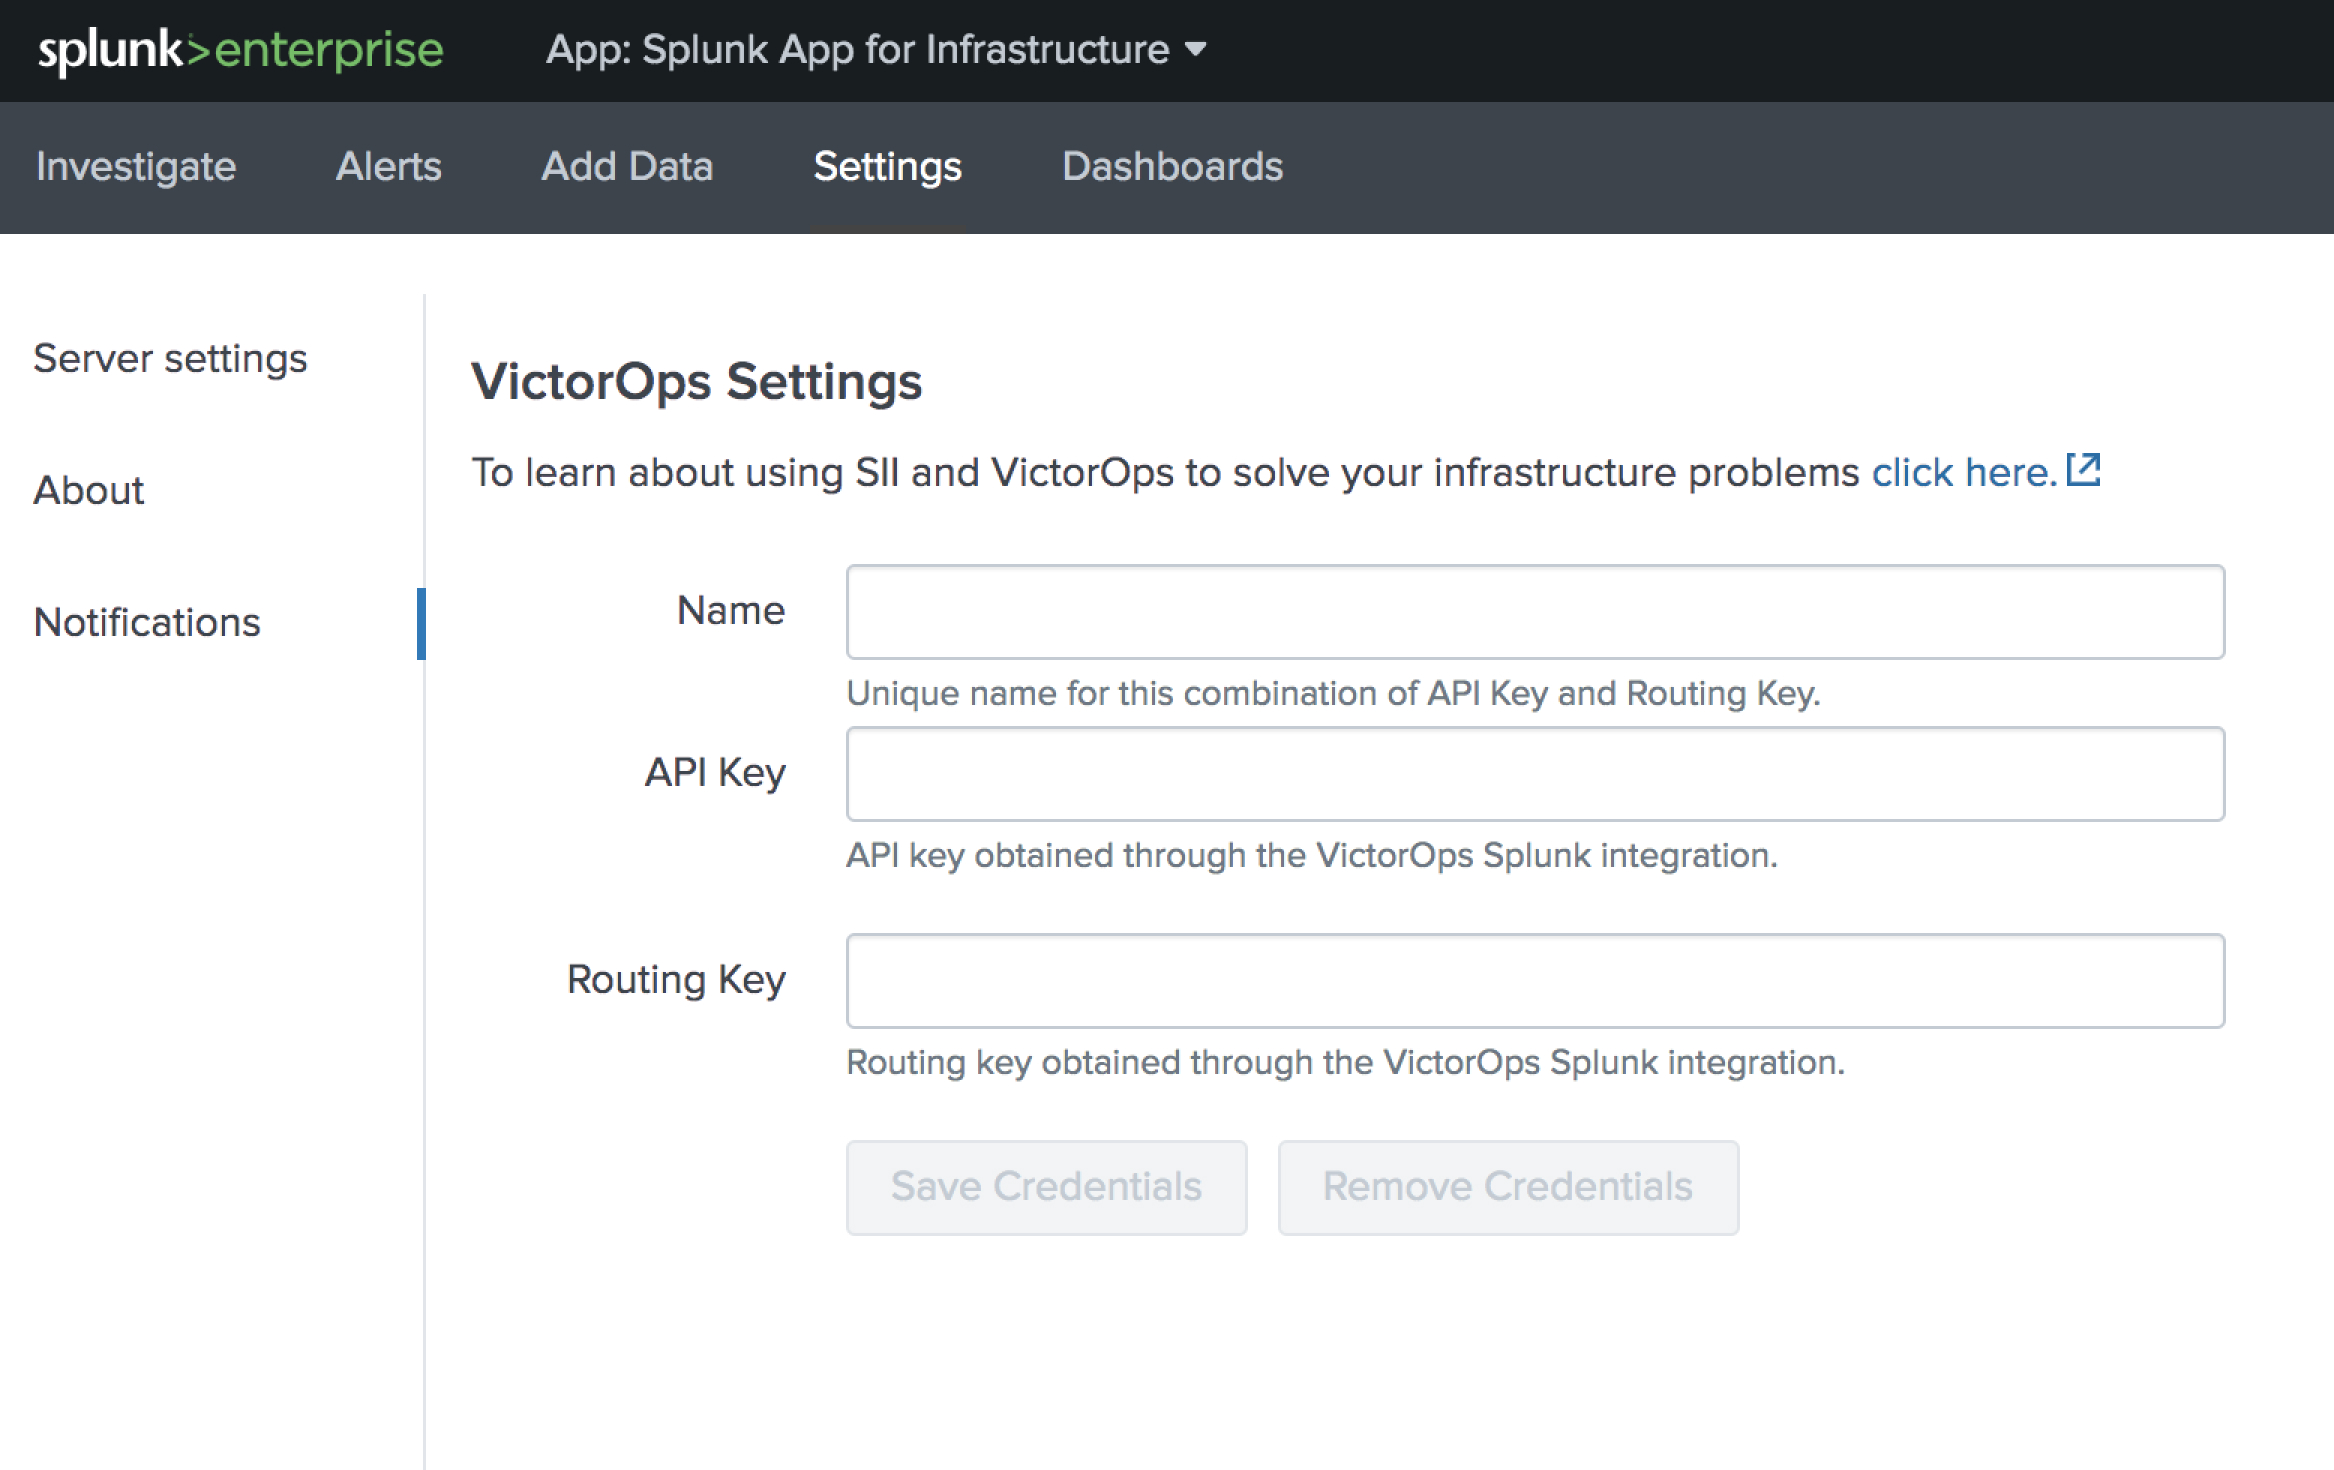
Splunk SAIで、Settings、Notifications に移動し、APIキーとSplunk On-Callアカウントのルーティングキーをそれぞれのフィールドに貼り付けます。Save Credentials を選択します。
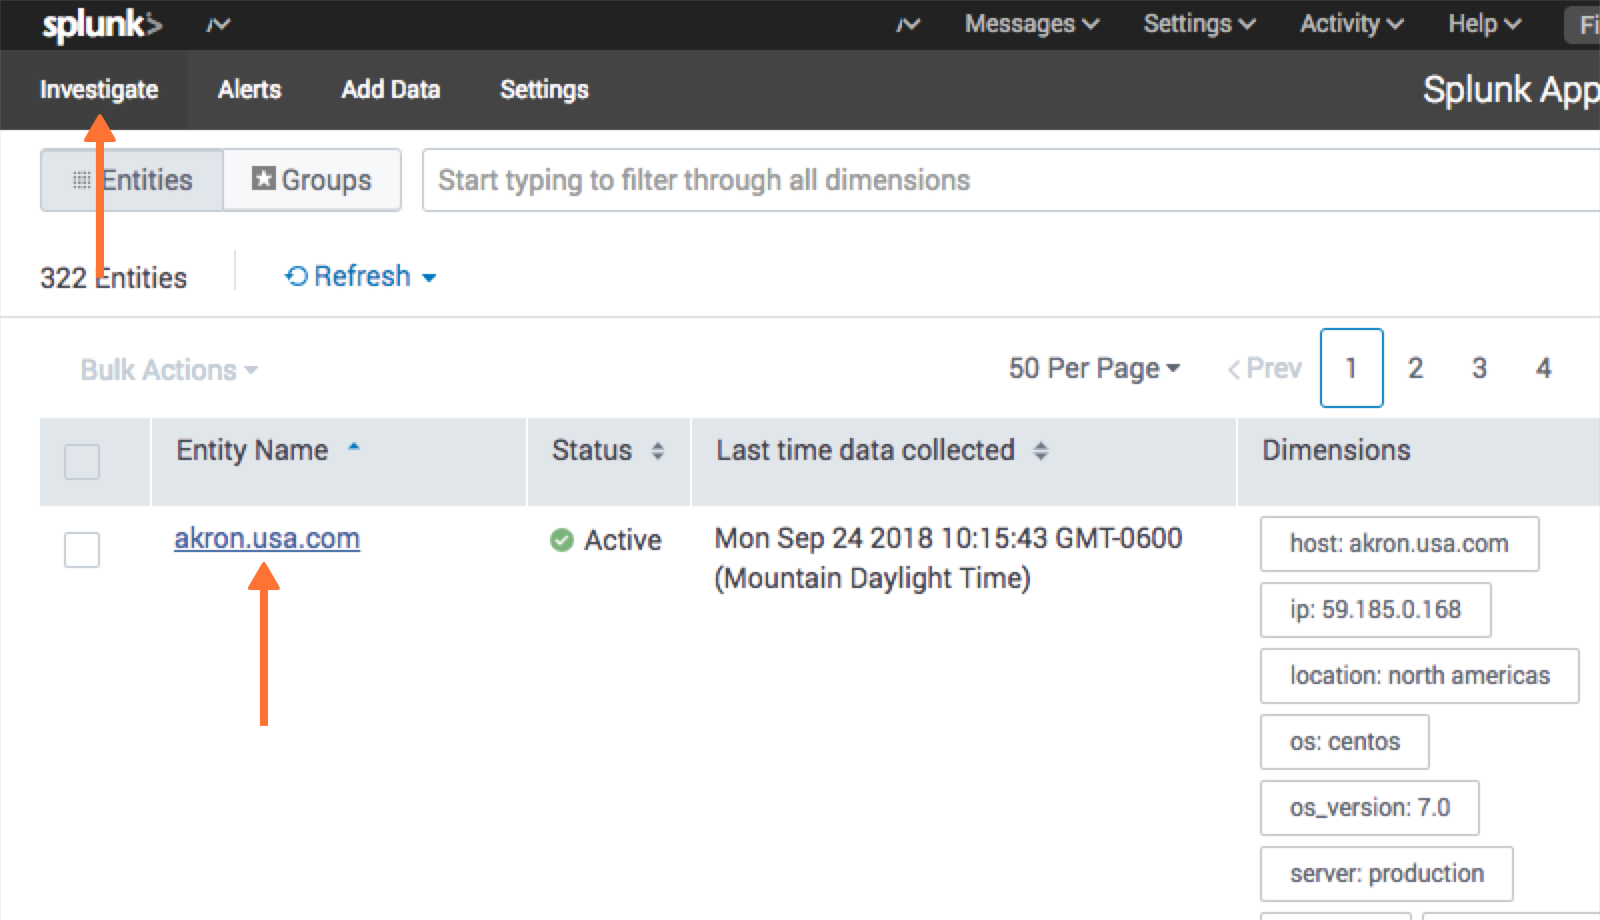
Investigate ページで、エンティティを選択します。
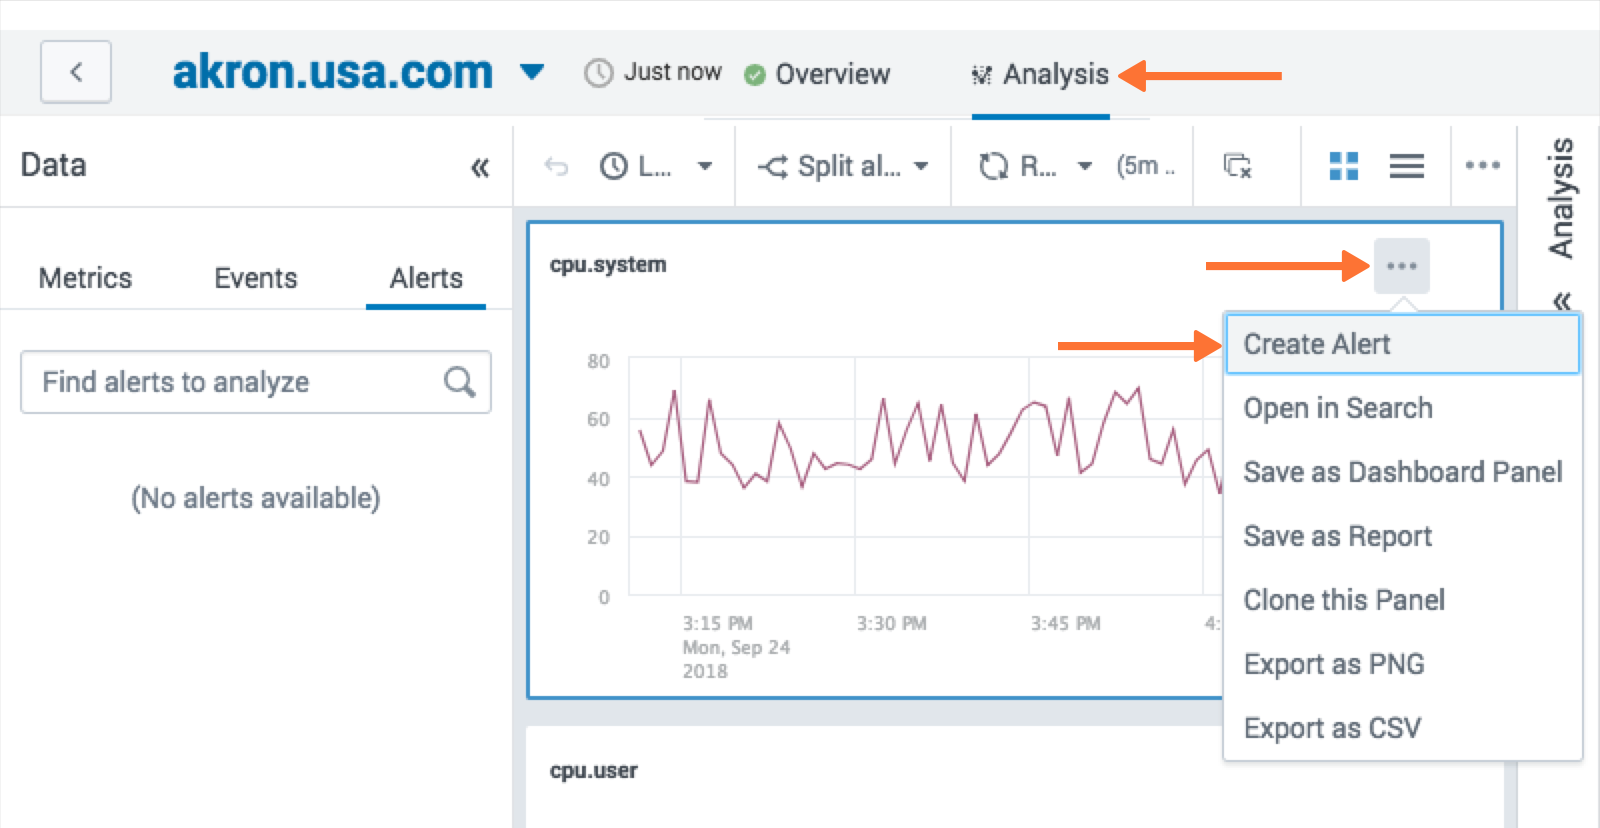
Analysis tab に移動し、アラートグラフを選択し、3つの点を選択し、Create Alert を選択します。
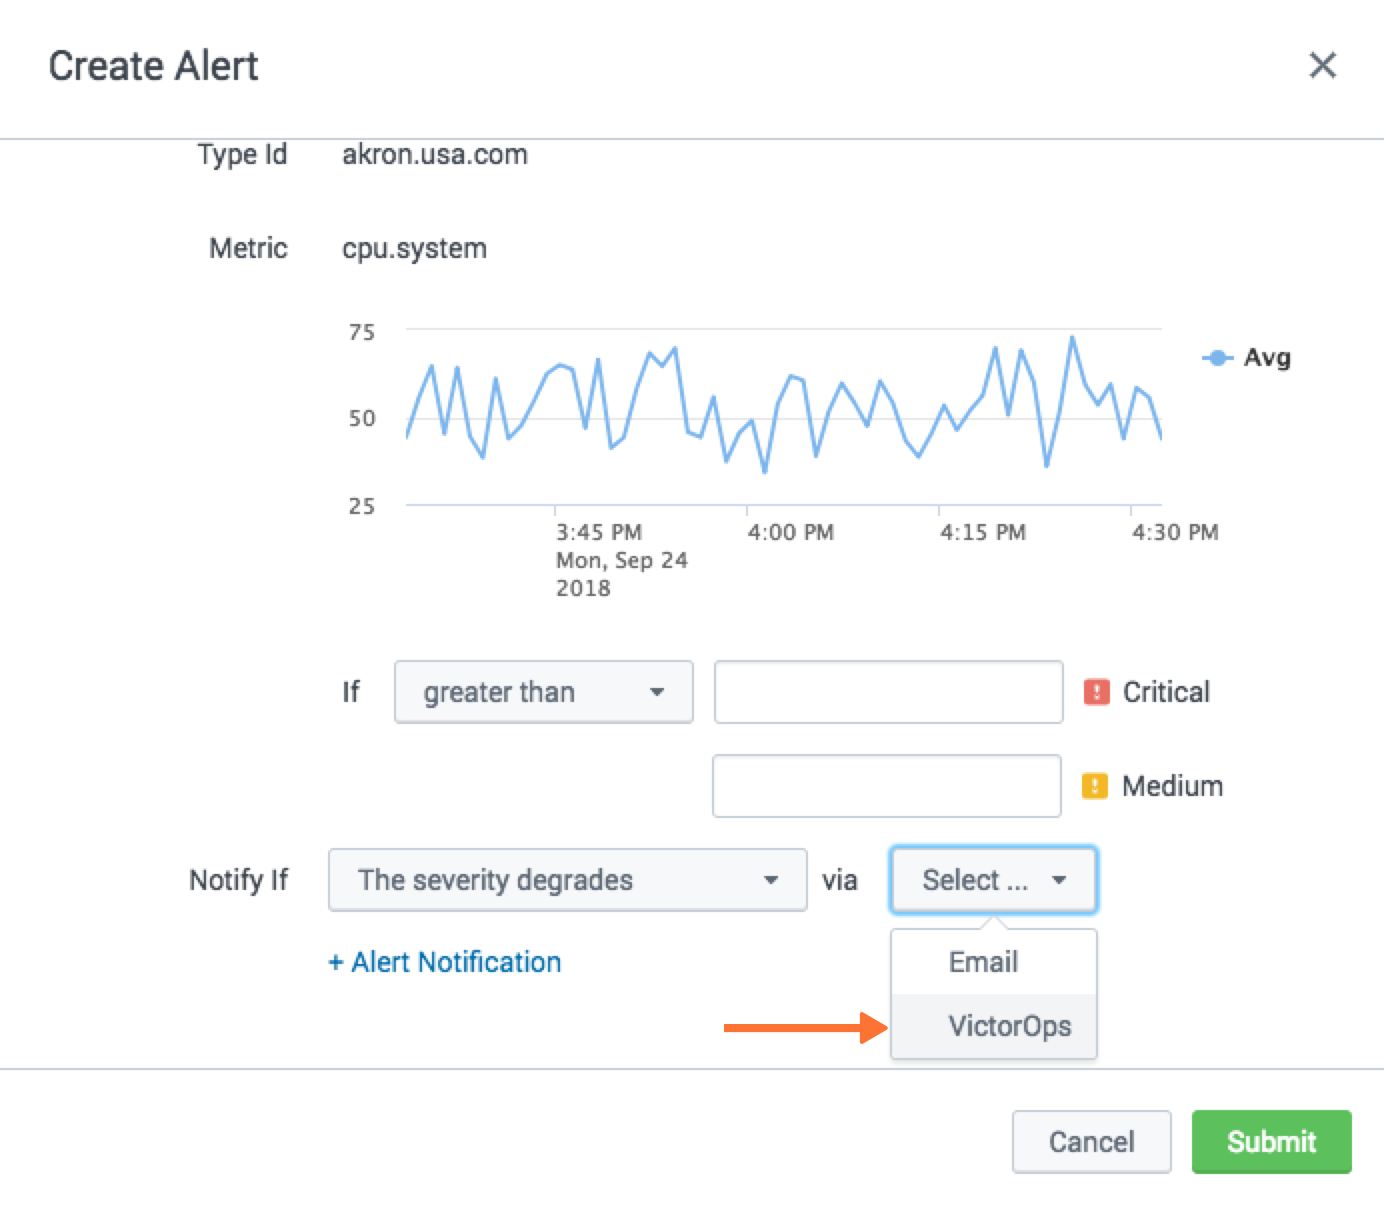
アラートの作成から、ダイアログの一番下までスクロールし、どのような条件でアラートを発火させるかを選択します。通知方法は Splunk On-Call を選択します。Submit を選択します。
Splunk Enterprise Security 🔗
Splunk Enterprise Security(ES)は、セキュリティチームがあらゆるデータを活用して組織全体の可視化とセキュリティインテリジェンスを実現することを可能にします。オンプレミス、パブリッククラウド、プライベートクラウド、SaaS、またはこれらの組み合わせなど、導入モデルに関係なく、Splunk ESは継続的なモニタリング、インシデント対応、セキュリティオペレーションセンターの運営、経営陣へのビジネスリスクの可視化などに使用できます。
In Splunk Enterprise Security App 🔗
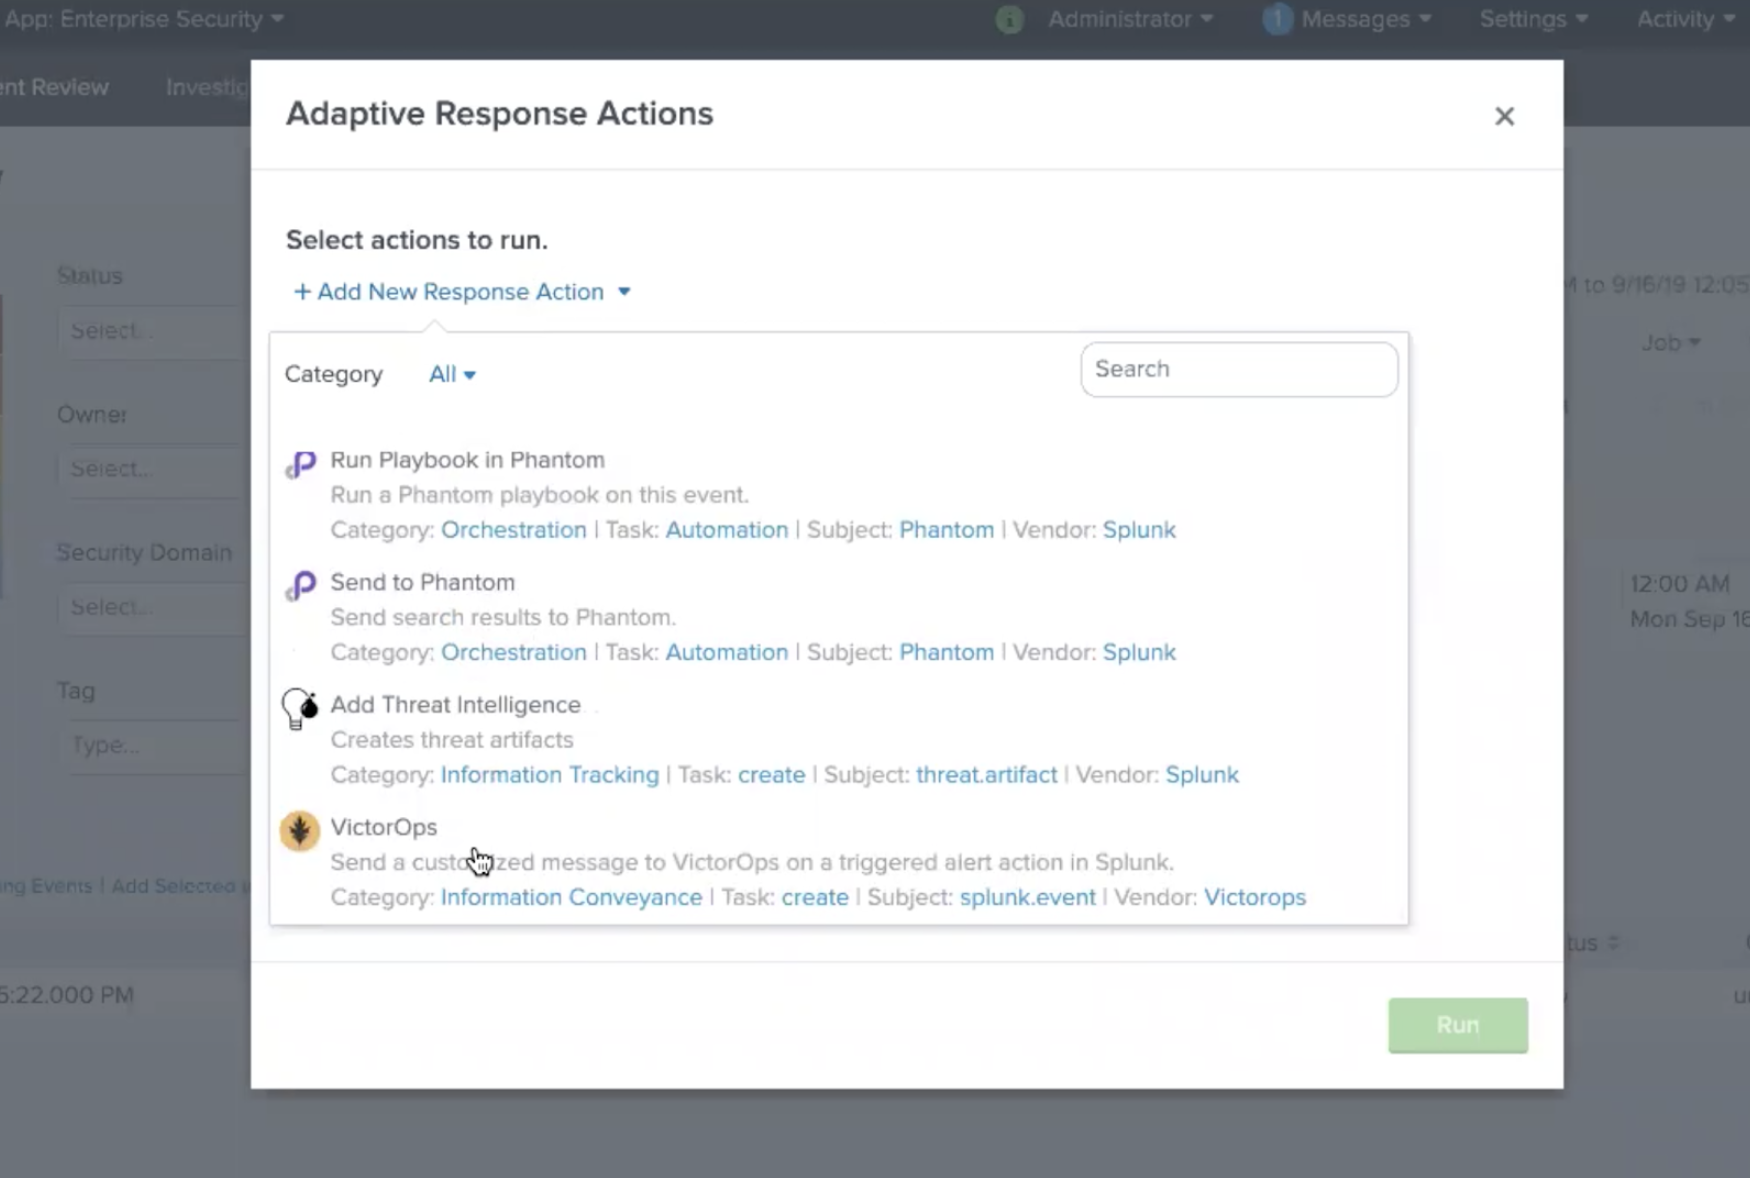
Incident Review インシデントレビューで、Splunk On-Callに送信するインシデントを選択し、Actions の下のメニューを選択します。次に、Run Adaptive Response Action を選択します。
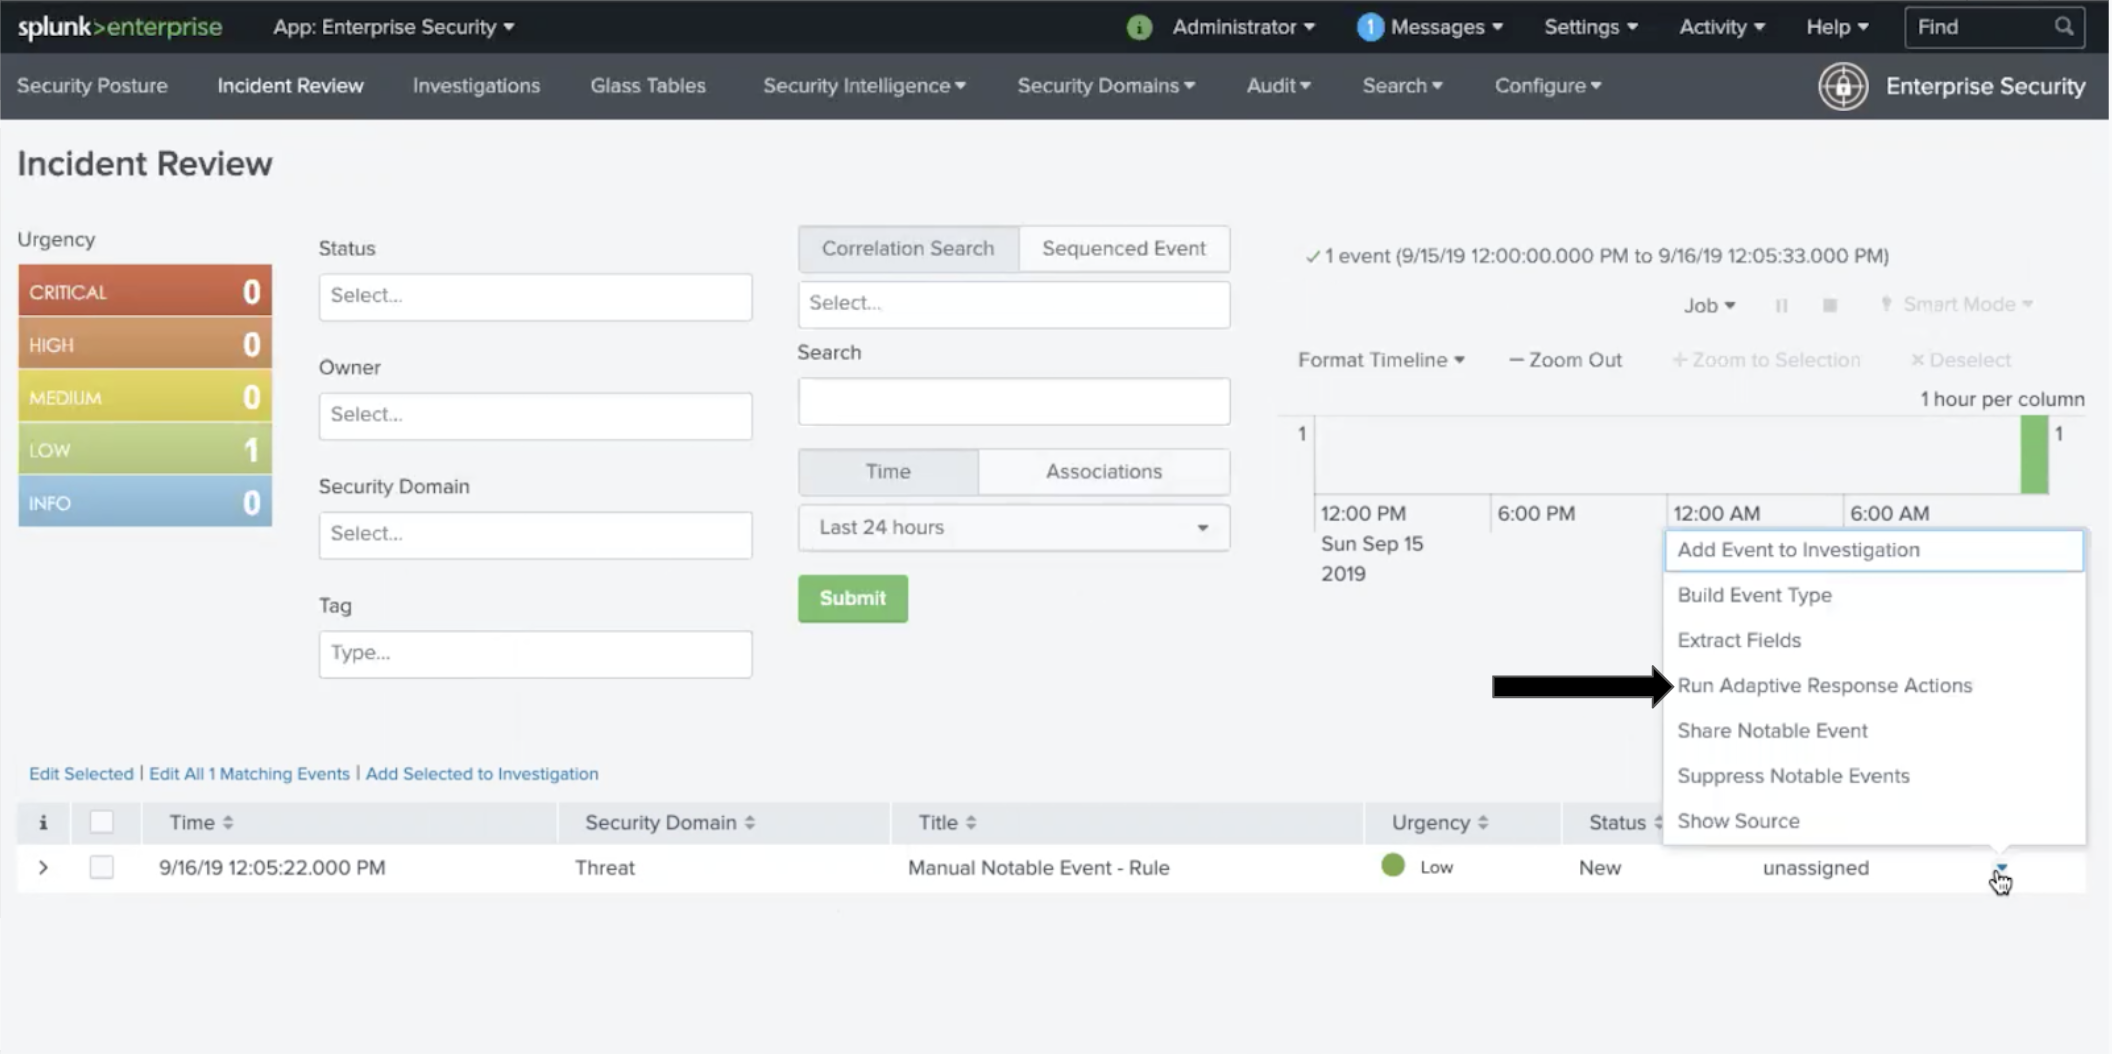
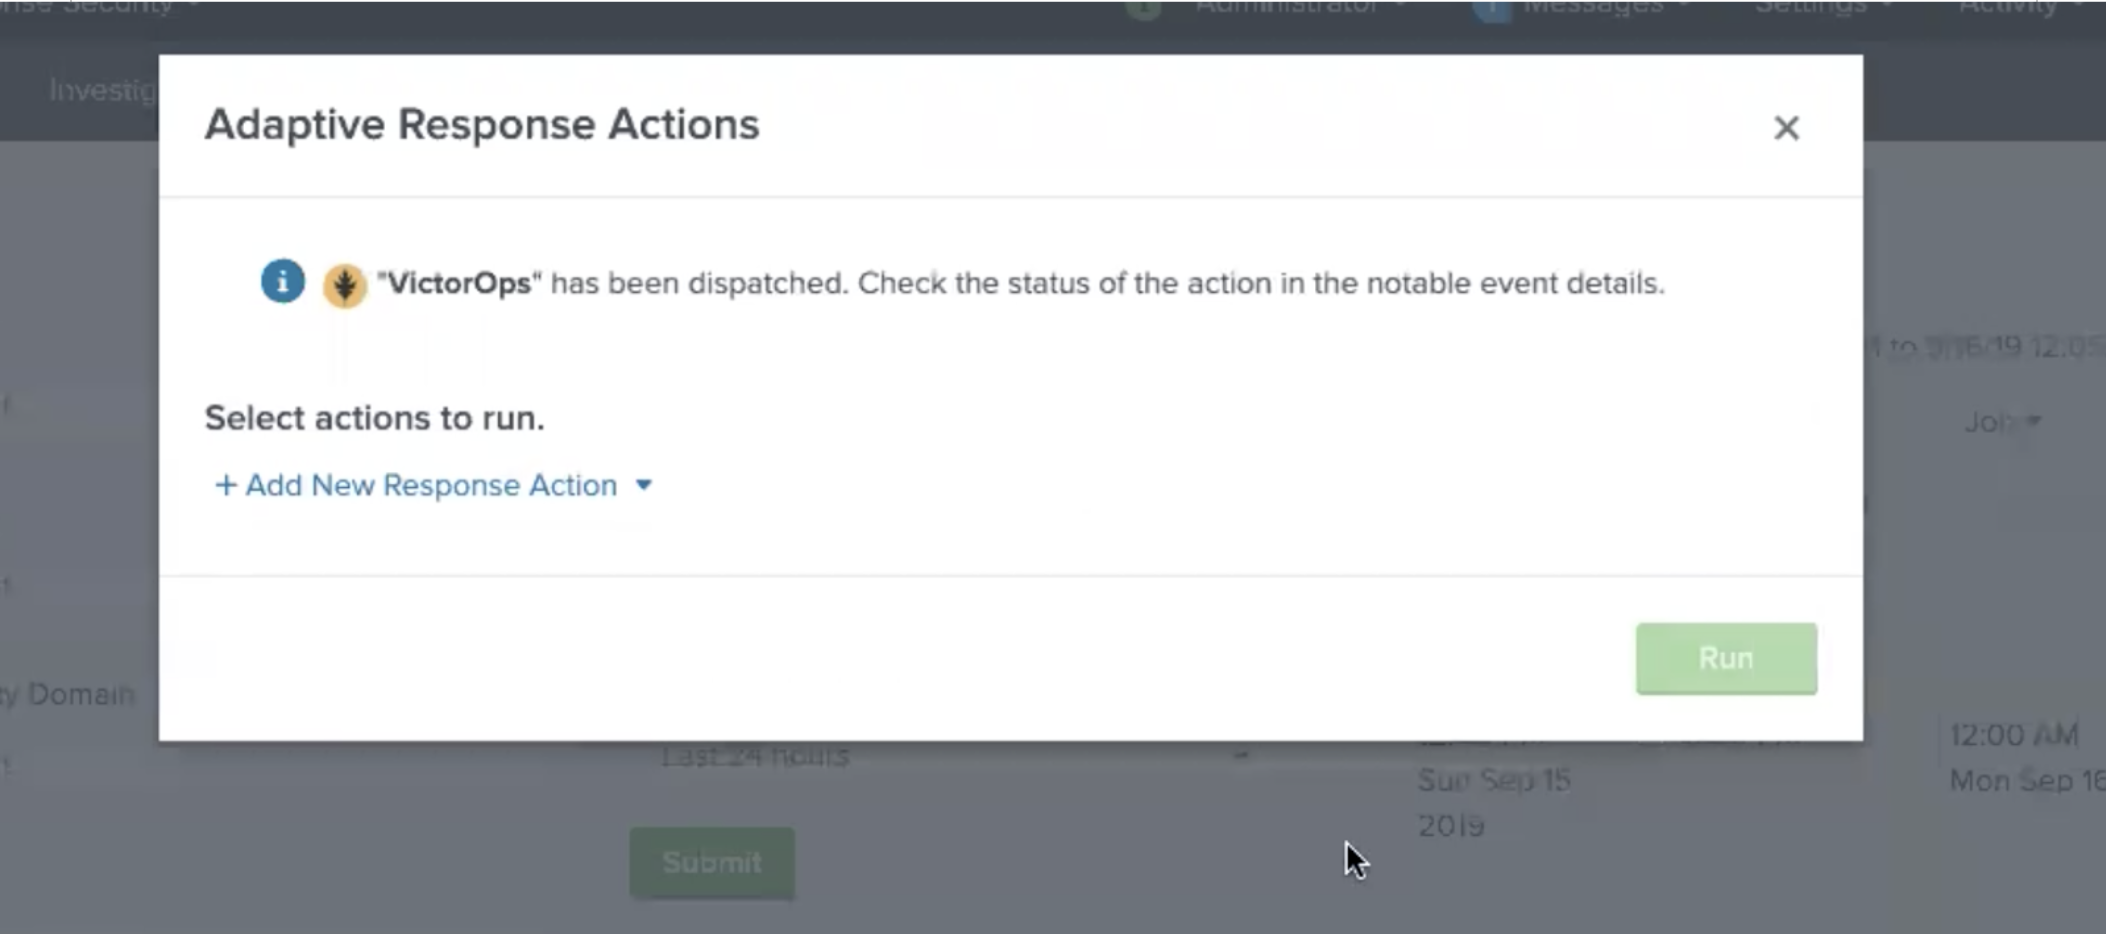
反応アクションとしてSplunk On-Callを追加できるダイアログが表示されます。
反応アクションが送信されると、確認メールが届きます。
トラブルシューティング 🔗
以下のトラブルシューティング手順を参照してください。それでも問題が解決しない場合は、問題の詳細な概要、最初に発生した時期、現在実行しているSplunkインスタンスとSplunk On-Callアプリのバージョンをお送りください。
Splunk On-Callアプリがインストールされましたが、アプリを設定できません。 🔗
Splunk On-Callのアラートを設定およびセットアップするために必要なアクセス許可を持っていることを確認してください。
アラートアクションをカスタマイズするオプションはありません。 🔗
これはSplunk On-Call App Alert Actionのアクセス許可がグローバルに設定されていないためです。Settings、Alert Actions にアクセスし、Splunk On-Call Appが**グローバル**共有に設定されていることを確認してください。
Splunk On-Callアラートアクションが表示されない 🔗
アラートアクション権限をリセットすると、この問題が解決することがあります。Settings、Alert Action、Splunk On-Call (Permissions) の順に移動します。Display For の次に、app にチェックを入れて保存し、権限を再度開いて All apps を選択します。アラートのトリガーアクションを確認して、Splunk On-Callアラートアクションが表示されているかどうかを確認します。
ルーティングキーの検索に失敗する 🔗
これは1つまたは複数のファイアウォールによって引き起こされることがあります。内部ネットワークの問題かどうかを確認するには、以下のcURLコマンドを実行してください:
curl -X POST
https://alert.victorops.com/integrations/generic/20131114/alert/SPLUNK_API_KEY –insecure -H”accept: application/json” -H “Content-Type:
application/json” -d ‘{“message_type”: “INFO”, “monitoring_tool”:
“splunk”, “state_message”: “Test Alert”, “entity_display_name”: “Test
Alert”}'\`
コマンドがSplunk On-Callに届かない場合は、$SPLUNK_HOME/var/log/splunk/victorops_modalert.log でSendalertをgrepして、その出力をSplunkサポートに、直面している問題の詳細な概要とともに送信してください。
Splunk On-Callアプリがアラートのアクションとして表示されない 🔗
*./splunk btool check –debug を実行し、ログと直面している問題の詳細な概要をSplunkサポートに送信してください。
Splunk On-CallでSplunk (enterprise)のアラートが通知されなくなった 🔗
以下のコマンドを実行して、内部ネットワークに問題がないか確認してください。投稿がSplunk On-Callに届いた場合は、ファイアウォールを確認してください。
curl -X POST
“https://alert.victorops.com/integrations/generic/20131114/alert/SPLUNK_API_KEY
–insecure -H”accept: application/json” -H “Content-Type:
application/json” -d ‘{“message_type”: “INFO”, “monitoring_tool”:
“splunk”, “state_message”: “Test Alert from localhost”,
“entity_display_name”: “Test Alert”}'\`
投稿がSplunk On-Callに届かない場合は、$SPLUNK_HOME/var/log/splunk/victorops_modalert.log でSendalertをgrepして、その出力と直面している問題の詳細な概要をSplunkサポートに送信してください。
ITSIバージョン4.0以下との統合 🔗
インテグレーションの一部は、旧バージョンのITSIには含まれていないシステムマクロに依存しています。この問題を軽減するために、Settings、Advanced Settings、Search Macros within Splunk に移動してマクロを作成することができます。以下のマクロが存在することを確認してください:
Macro |
定義 |
|---|---|
|
|
|
|
|
|