Splunk On-CallのOpsDashインテグレーション 🔗
OpsDashは、サーバー、サービス、データベース、アプリケーションメトリクスを監視します。次のガイドでは、両方のシステムを統合するために必要な手順を示します。
In Splunk On-Call 🔗
Splunk On-Callから、Settings、Alert Behavior、Integrations に移動します。
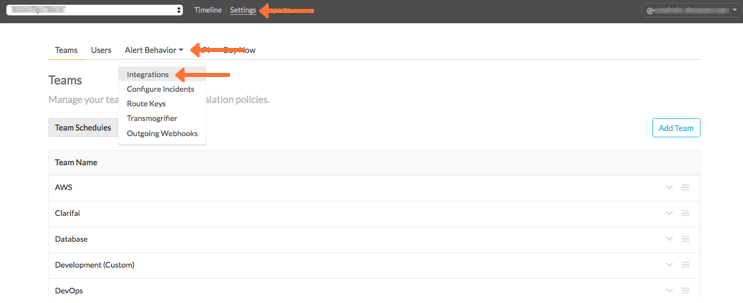
OpsDash インテグレーションを選択し、Service API Endpoint の値をクリップボードにコピーします。
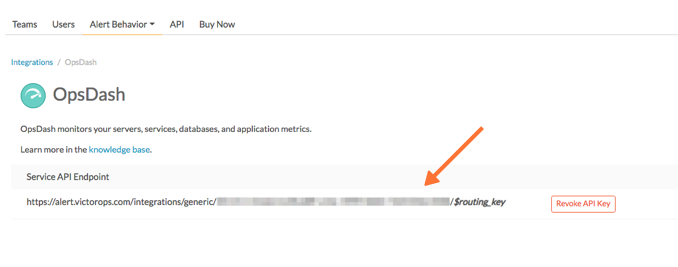
URLの末尾に適切なルーティングキーを追加してください。詳しくは Splunk On-Callでルーティングキーを作成する を参照してください。
In OpsDash 🔗
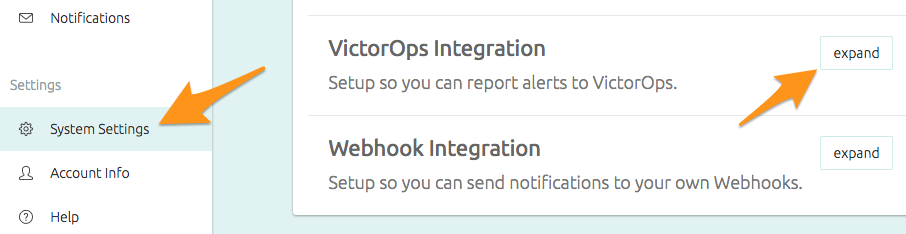
Scalyrで、System Settings タブを選択し、VictorOpsインテグレーションの横に展開します。
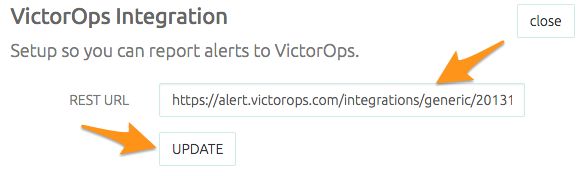
前のセクションのサービスAPIエンドポイントを REST URL フィールドに貼り付け、UPDATE を選択します。
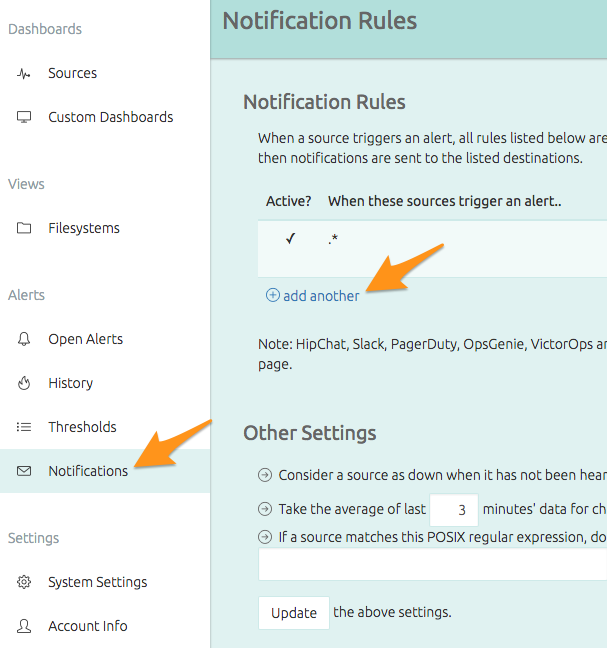
Notifications` タブを選択し、Notification Rules の下にある Add another を選択します。
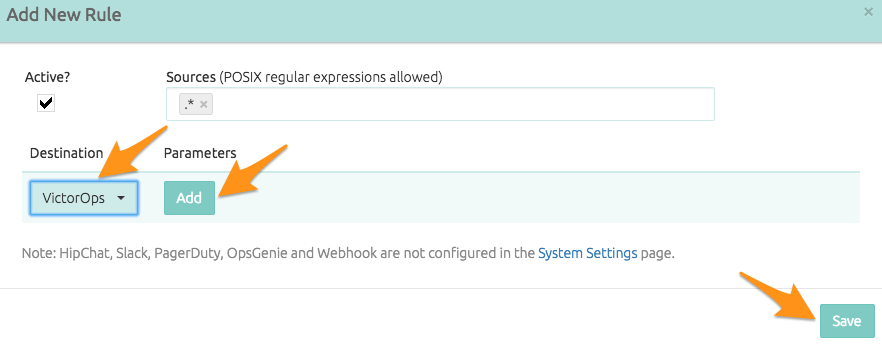
Add New Rule ウィンドウで、メニューから VictorOps を選択し、Add、Save の順に選択します。
これで、OpsDashでテストアラートを設定して、インテグレーションが機能していることを確認できます:
任意のソースを選択してダッシュボードを開き、任意のグラフを選択します。
下にスクロールし、アラートを出したい指標を選択します。
下にスクロールし、アラートしきい値を追加します。
アラートを即座にトリガーできる値を追加します。必ず保存してください。
1分ほどで、OpsDashにアラートが生成されます。生成されない場合は、しきい値の設定を調整する必要があるかもしれません。