Splunk On-CallのElasticsearch Watcherインテグレーション 🔗
Elasticsearchは分散型のRESTフルな検索分析エンジンであり、増え続けるユースケースを解決することができます。WatcherはElasticsearch用のプラグインで、データの変更に基づくアラートと通知を提供します。Splunk On-CallとElasticsearch Watcherのインテグレーションを利用して、クラスターやインデックスのイベントに対してアラートを出すことができます。ネットワークアクティビティを追跡し、インフラストラクチャを監視して、アラートを自動化して変換し、社内で通信して問題を迅速に修正します。
Elasticsearch WatcherとSplunk On-Callを使用して、しきい値、スマートアラートルーティング、エスカレーションポリシーを設定し、該当する関係者に通知が必要なときに通知します。
インテグレーションによって以下のことができます。
Splunk On-Callタイムラインでは、Elasticsearch Watcherのログとクラスターの健全性監視データを活用することで、システムの観測性を向上させます。
重要なメトリクスにしきい値を設定してアラートを自動化し、重要な問題をオンコールのインシデントマネージャーに通知します。
オンコール・スケジュールの管理、アラートルーティングとエスカレーションポリシーの設定、モニタリングデータの集約、インシデントを迅速に解決するためのコンテキストとのコラボレーションを単一の画面で実現します。
Splunk On-CallでElasticsearch Watcherを有効化する 🔗
Splunk On-Callから、Integrations、3rd Party Integrations、Elasticsearch Watcher と進み、*Enable Integration を選択します。
次のステップで使用するため、Service API Key をコピーします。
ElasticsearchでのKibanaの使用 🔗
Elastic CloudのホームページからKibanaにアクセスします。
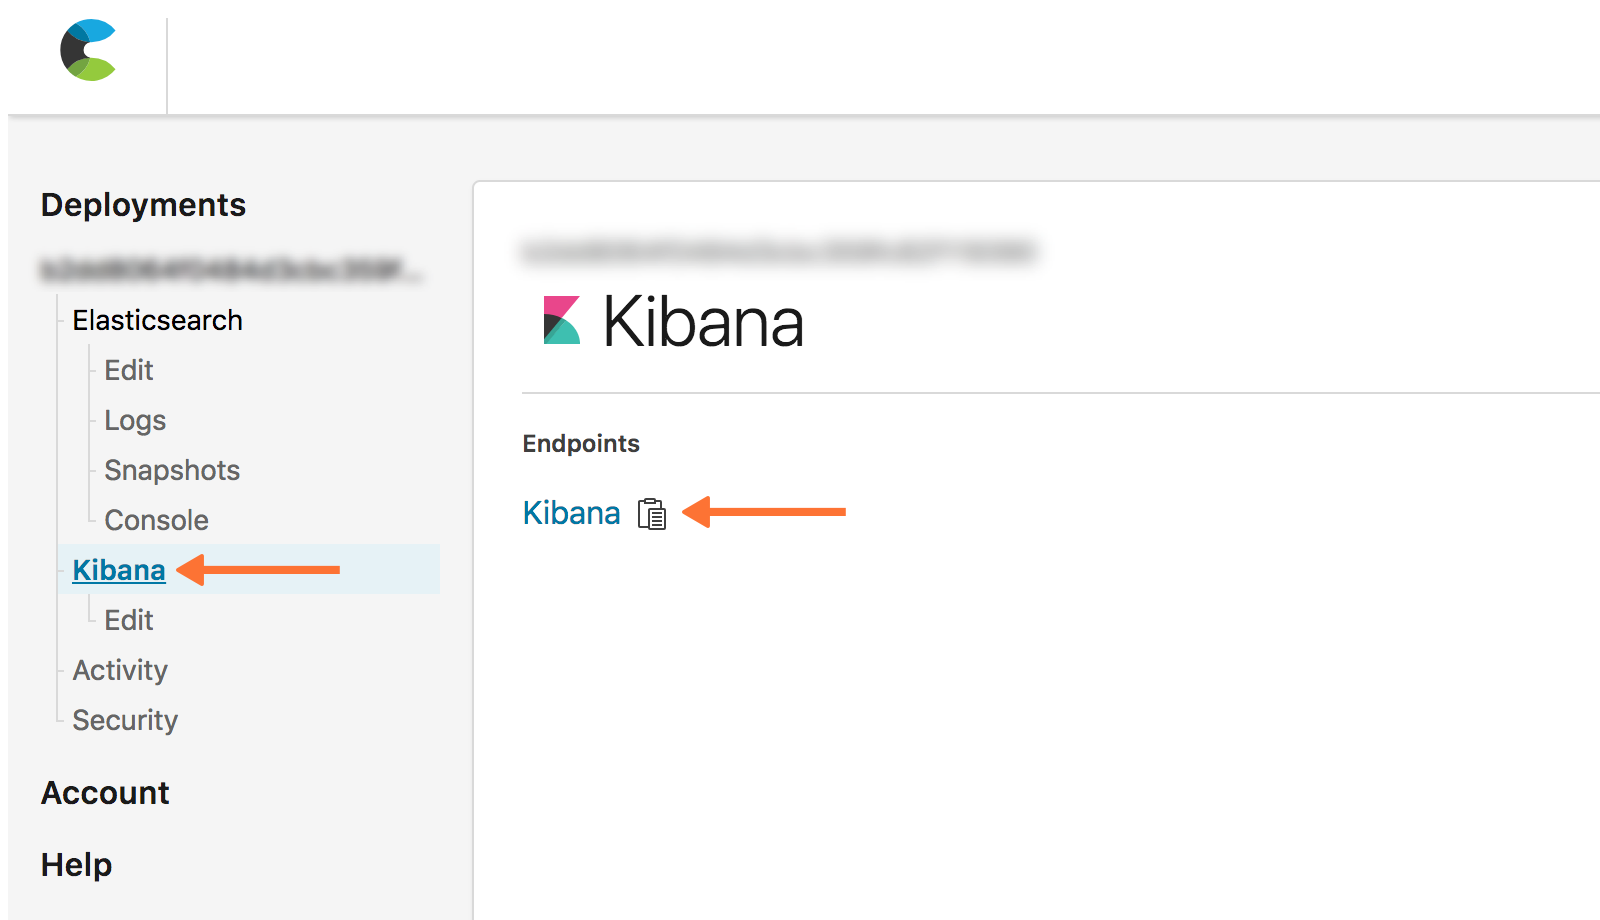
Kibanaにログインし、Management、Watcher の順に移動し、新しい Advanced Watch を作成します。
このウォッチで、アクションオブジェクトを以下のように設定します。
$service_api_keyと$routing_keyは、組織の値に置き換えてください。
 "actions": {
  "victorops": {
    "webhook": {
      "scheme": "https",
      "host": "alert.victorops.com",
      "port": 443,
      "method": "post",
      "path": "/integrations/generic/20131114/alert/$service_api_key/$routing_key",
      "params": {},
      "headers": {
        "Content-type": "application/json"
      },
      "body": "{\"message_type\": \"CRITICAL\",\"monitoring_tool\": \"Elastic Watcher\",\"entity_id\": \"{{ctx.id}}\",\"entity_display_name\": \"{{ctx.watch_id}}\",\"state_message\": \"{{ctx.watch_id}}\",\"elastic_watcher_payload\": {{#toJson}}ctx.payload{{/toJson}} }"
    }
  }
}
Elasticsearch Watcherを設定する 🔗
コマンドラインから、Watcherがサーバー上で実行されていることを確認します:
curl -XGET 'http://localhost:9200/_watcher/stats?pretty'
Watcherの状態が」started」であることを示す応答を受け取ります:
{
"watcher_state" : "started",
"watch_count" : 5,
"execution_thread_pool" : {
"queue_size" : 0,
"max_size" : 10
},
"manually_stopped" : false
}
ウォッチAPIにPUTリクエストを送り、新しいウォッチを登録するか、既存のウォッチを更新します。
$routing_keyを使用するルーティングキーに置き換えます。ルーティングキーの詳細については、Splunk On-Callでルーティングキーを作成する を参照してください。Elasticドキュメントの Watch API PUT を参照してください。以下の例では、cURLを使用して、60秒ごとにSplunk On-Callにアラートを送信するウォッチを作成し、インテグレーションが機能していることを確認できるようにしています。JSONオブジェクトのアクションセクションでは、WatcherがSplunk On-Callにアラートを送信するように設定し、オブジェクトの残りの部分では、アラート送信のトリガーとなる条件を設定します。
curl -XPUT 'http://localhost:9200/_watcher/watch/cluster_health_watch' -d '{
"trigger" : {
"schedule" : { "interval" : "60s" }
},
"input" : {
"http" : {
"request" : {
"host" : "localhost",
"port" : 9200,
"path" : "/_cluster/health"
}
}
},
"condition" : {
"always" : {}
},
"actions" : {
"victorops" : {
"webhook" : {
"scheme" : "https",
"method" : "POST",
"host" : "alert.victorops.com",
"port" : 443,
"path" : "/integrations/generic/20131114/alert/$service_api_key/$routing_key",
"body" : "{\"message_type\": \"CRITICAL\",\"monitoring_tool\": \"Elastic Watcher\",\"entity_id\": \"{{ctx.id}}\",\"entity_display_name\": \"{{ctx.watch_id}}\",\"state_message\": \"{{ctx.watch_id}}\",\"elastic_watcher_payload\": {{#toJson}}ctx.payload{{/toJson}} }",
"headers" : {"Content-type": "application/json"}
}
}
}
}'
Splunk On-Callタイムラインにアラートが表示されていることを確認します。