Splunk On-CallのPRTGインテグレーション 🔗
PRTG Network Monitorは、サーバーインフラストラクチャのための、サーバーのアップタイムと利用率、ネットワーク監視、帯域幅利用ソフトウェアパッケージです。SNMP、パケットスニッフィング、Netflowを使用して、ネットワーク内の帯域幅の使用状況を監視し、分類することができます。次のガイドでは、このインテグレーションのインストールと設定について説明します。
In Splunk On-Call 🔗
Splunk On-Call Webポータルから、Integrations を選択します。
インテグレーションオプションのリストから、PRTG (webhook) インテグレーションオプションを選択します。
結果のページで、Service API Endpoint をクリップボードにコピーします。このエンドポイントの」$routing_key」の部分は、必ず使用する実際のルーティングキーに置き換えてください。
In PRTG Network Monitor 🔗
サーバーで、C:\Program Files (x86)\PRTG Network Monitor\Notifications\EXE に移動し、prtgtovictorops.ps1 という名前のファイルを作成します。そのファイルに以下のコードを貼り付け、更新したファイルを保存します。
Param( [string]\ :math:`API\_URL,  \[string\]`\ MessageType,
[string]\ :math:`SiteName,  \[string\]`\ Device,
[string]\ :math:`DeviceId,  \[string\]`\ Name,
[string]\ :math:`Status,  \[string\]`\ Down,
[string]\ :math:`DateTime,  \[string\]`\ LinkDevice, [string]$Message )

Add-Type -AssemblyName System.Web.Extensions function ConvertTo-Json
([Object] $value) {
[System.Web.Script.Serialization.JavaScriptSerializer] $jsSerializer =
New-Object ‘System.Web.Script.Serialization.JavaScriptSerializer'
:math:`jsSerializer.Serialize(`\ value) }

function setMessageType ([string]
:math:`inputString) {  If (`\ inputString -like “Up\*”) { return
‘recovery' } elseif
(:math:`inputString -like "Down\*")  {  return 'critical'  }  elseif (`\ inputString
-like “Warning\*”) { return ‘warning' } else { return ‘info' } }

:math:`postVOAlert = ConvertTo-Json(@{ message\_type = SetMessageType(`\ Status);
entity_id = $DeviceId; entity_display_name = $Device; monitoring_tool =
“PRTG”; site_name =
:math:`SiteName; link\_device = "<`\ (:math:`LinkDevice)|`\ ($Device)
:math:`(`\ Name)>“; status =”\ :math:`(`\ Status) :math:`(`\ Down) on
:math:`(`\ DateTime)“; state_message = $Message; })

[Net.ServicePointManager]::SecurityProtocol =
[Net.SecurityProtocolType]::Tls12 $postVOAlert \| Out-File -FilePath
vo.log

[System.Net.WebClient] $webclient = New-Object ‘System.Net.WebClient'
$webclient.Headers.Add(“Content-Type”,“application/json”)
:math:`webclient.UploadData(`\ API_URL,
[System.Text.Encoding]::UTF8.GetBytes($postVOAlert)) \| Out-File
-FilePath vo.log -Append
サーバーのデスクトップから、PRTG Enterprise Console を開きます。
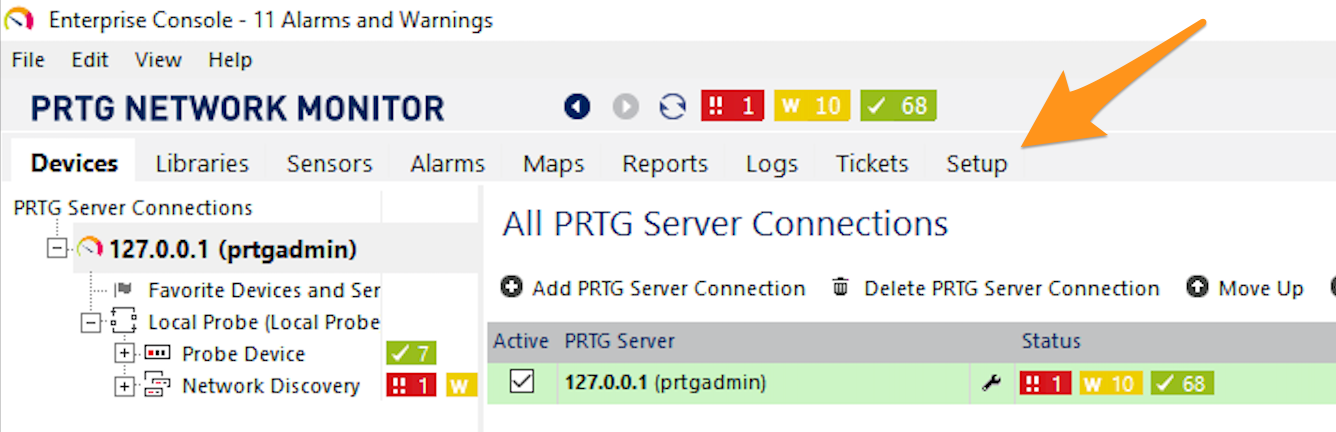
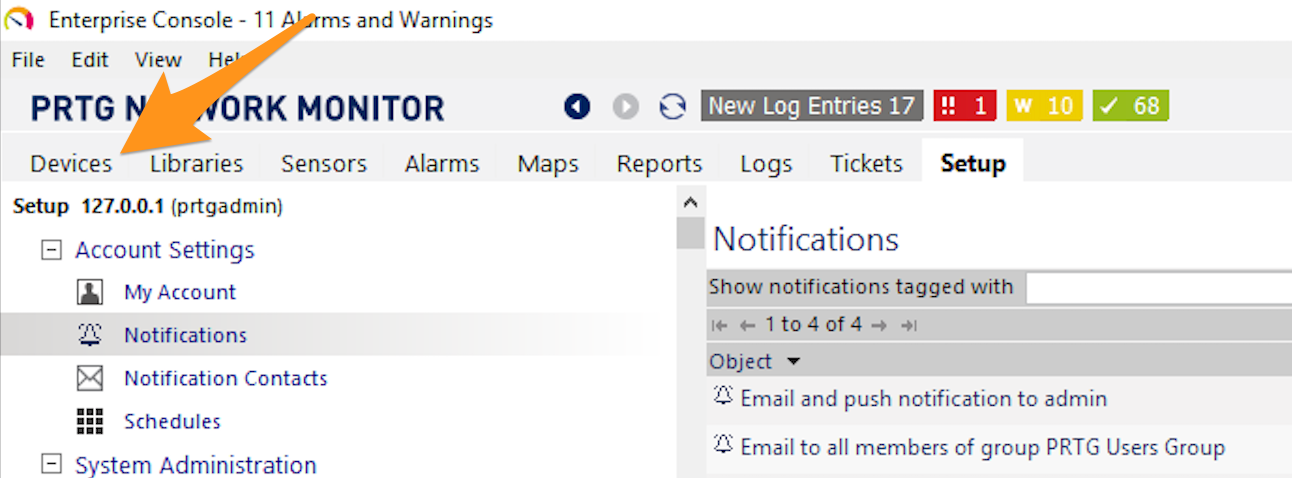
PRTG Enterprise Consoleで、Setup タブを選択します。
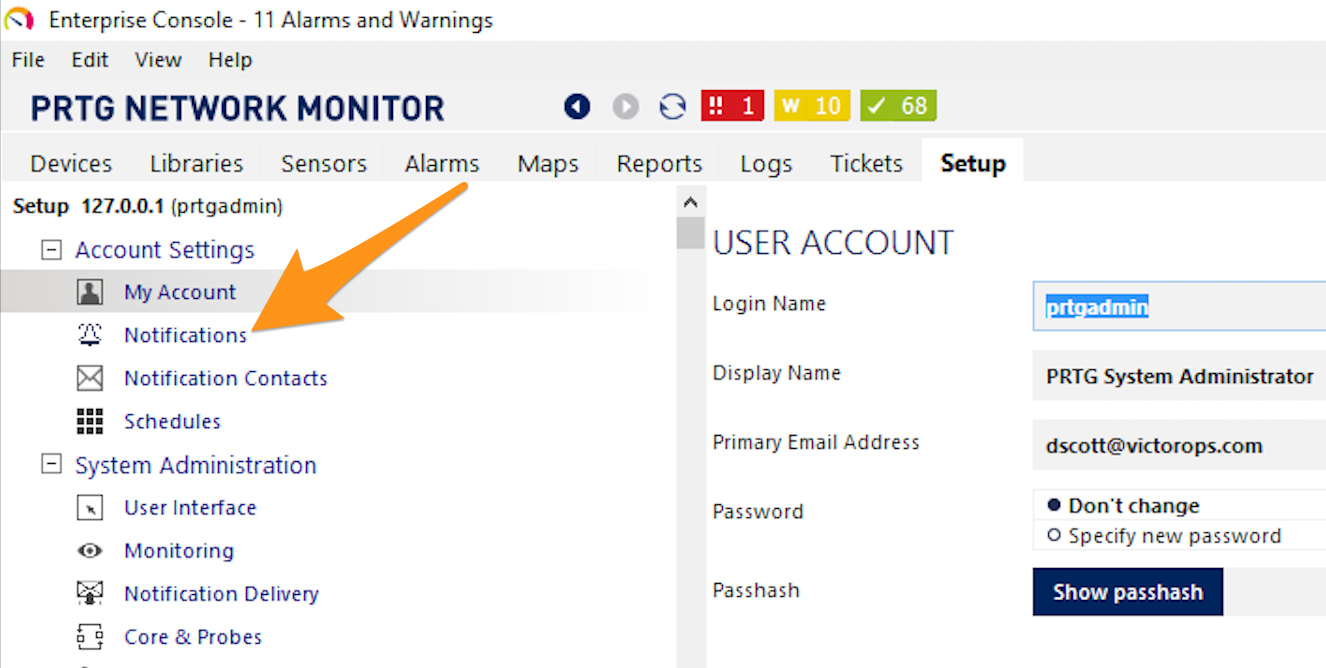
「アカウント設定」で Notifications を選択します。
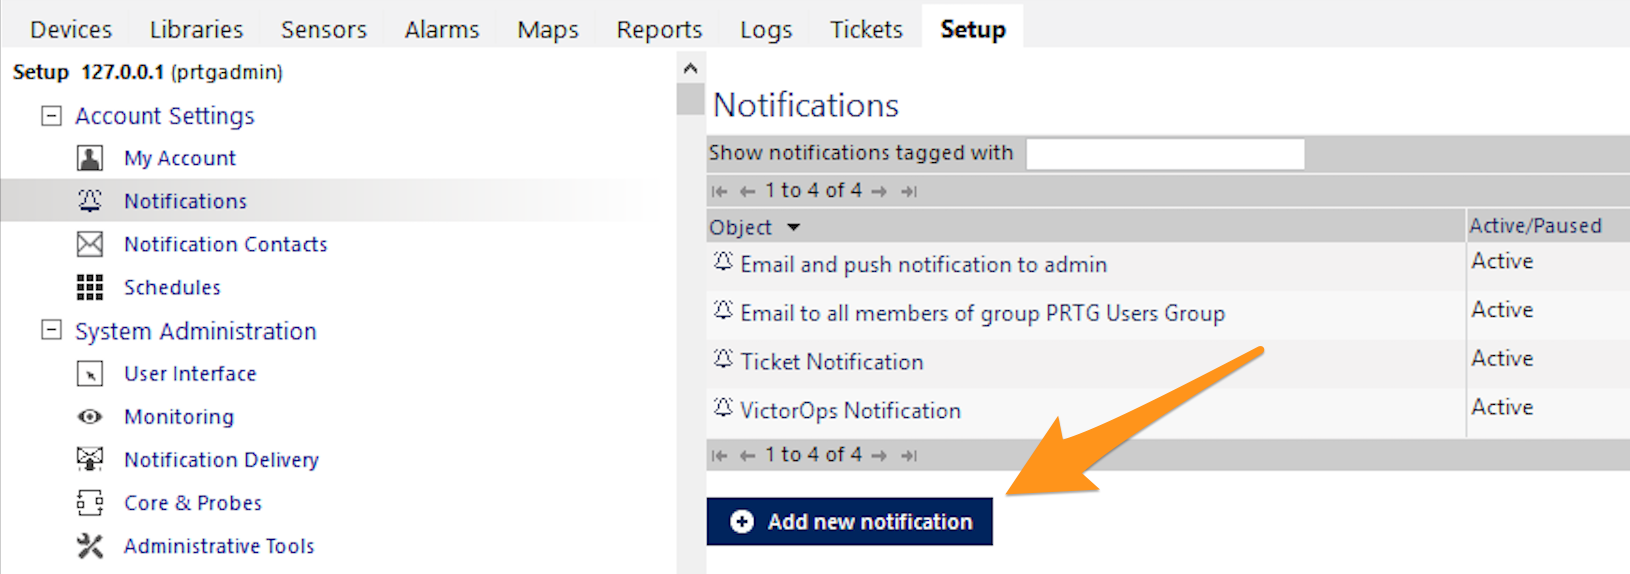
Add new notification を選択します。
「通知名」フィールドに「Splunk On-Call Notification」と入力し、「メソッド」に Always notify ASAP, never summarize を選択します。
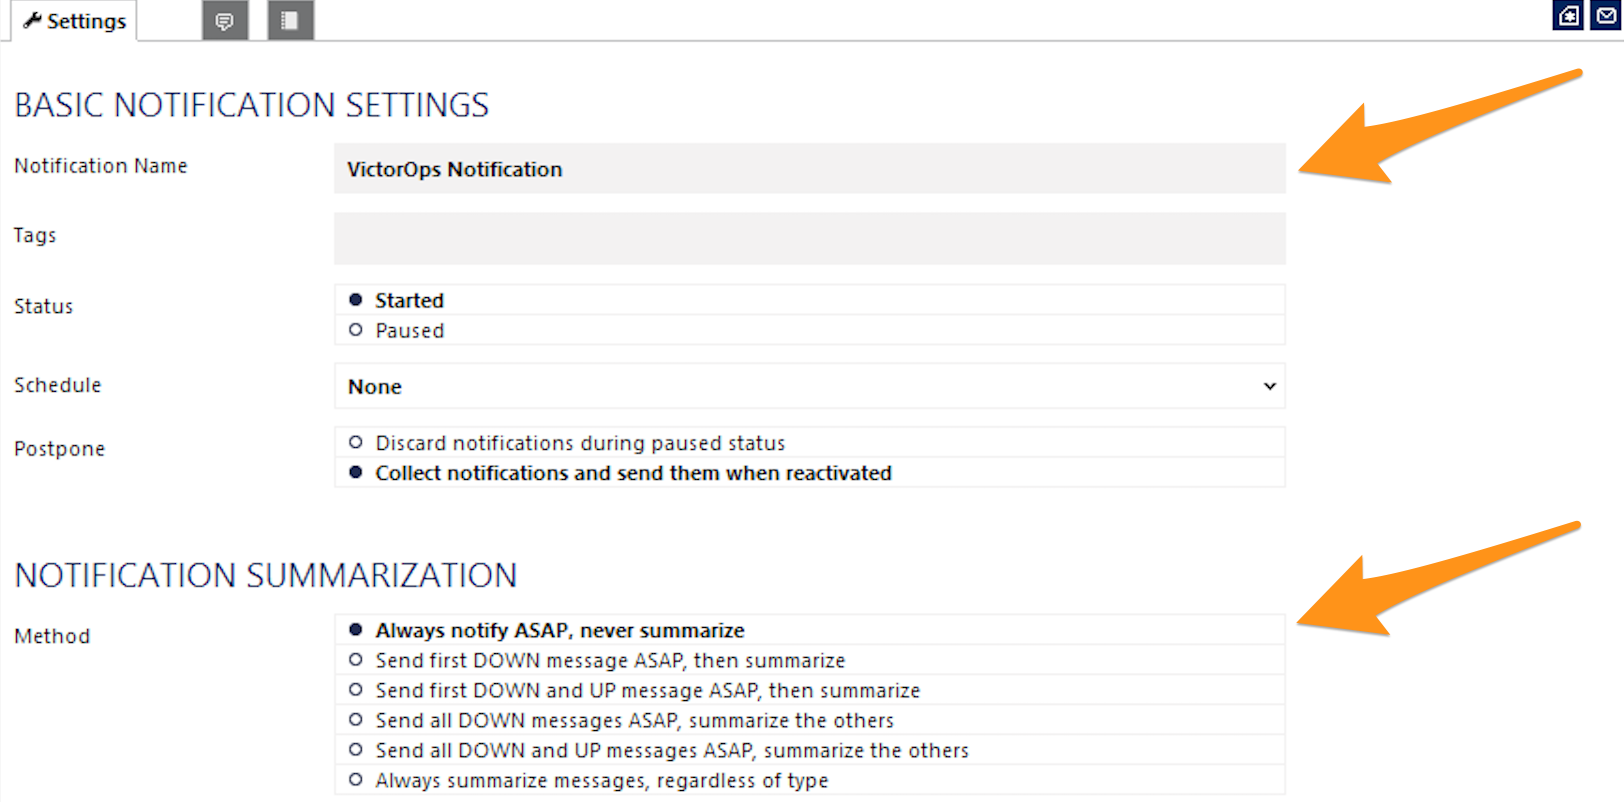
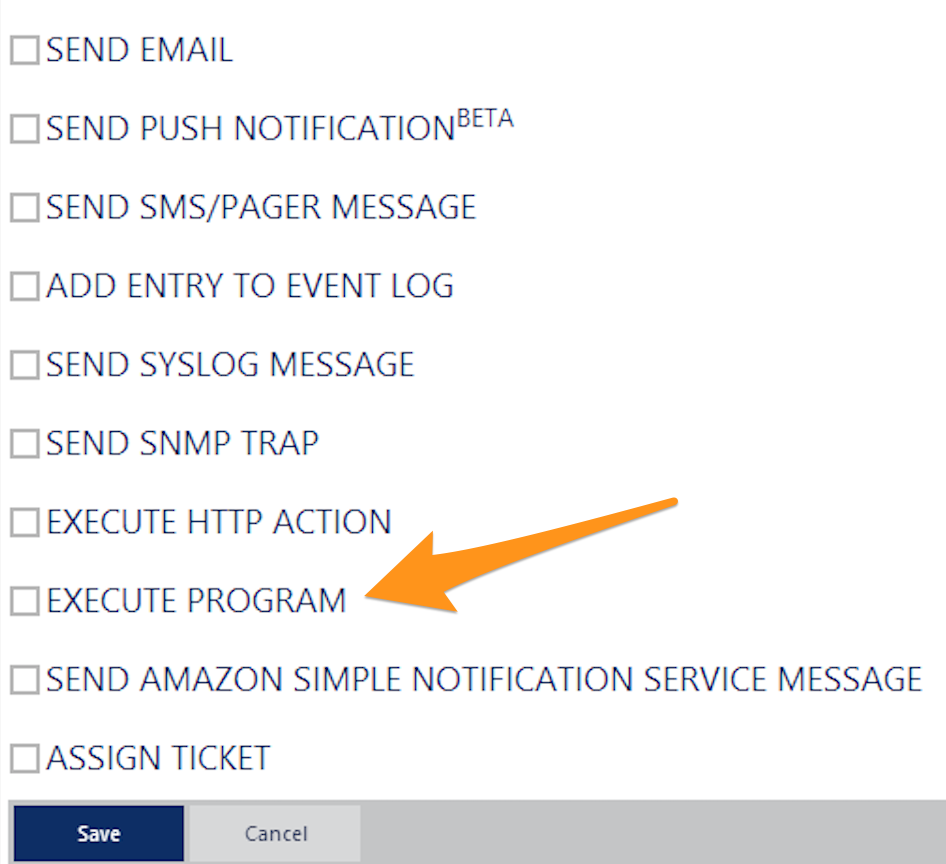
下にスクロールし、EXECUTE PROGRAM を選択します。
「プログラムファイル」ドロップダウンメニューから Prtgtovictorops.ps1 を選択し、」Parameter」フィールドに以下を貼り付けて、URL_to_notify を」In Splunk On-Call」セクションから」通知するURL」に置き換えてください。
-API_URL 'URL_to_notify' -SiteName '%sitename' -Device '%device'
-DeviceId '%deviceid' -Name '%name' -Status '%status' -Down '%down'
-DateTime '%datetime' -LinkDevice '%linkdevice' -Message '%message'
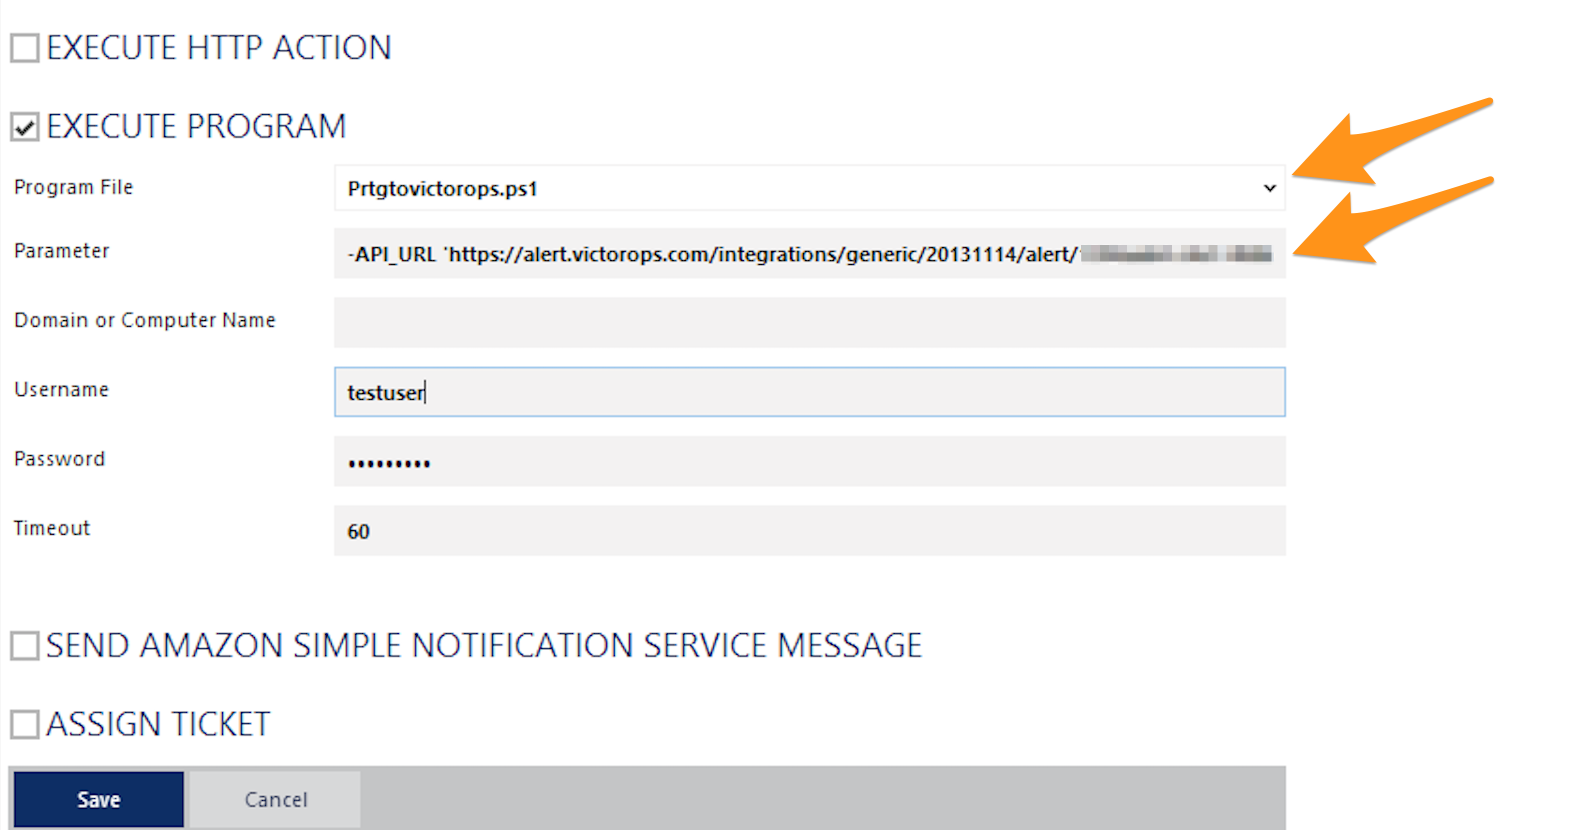
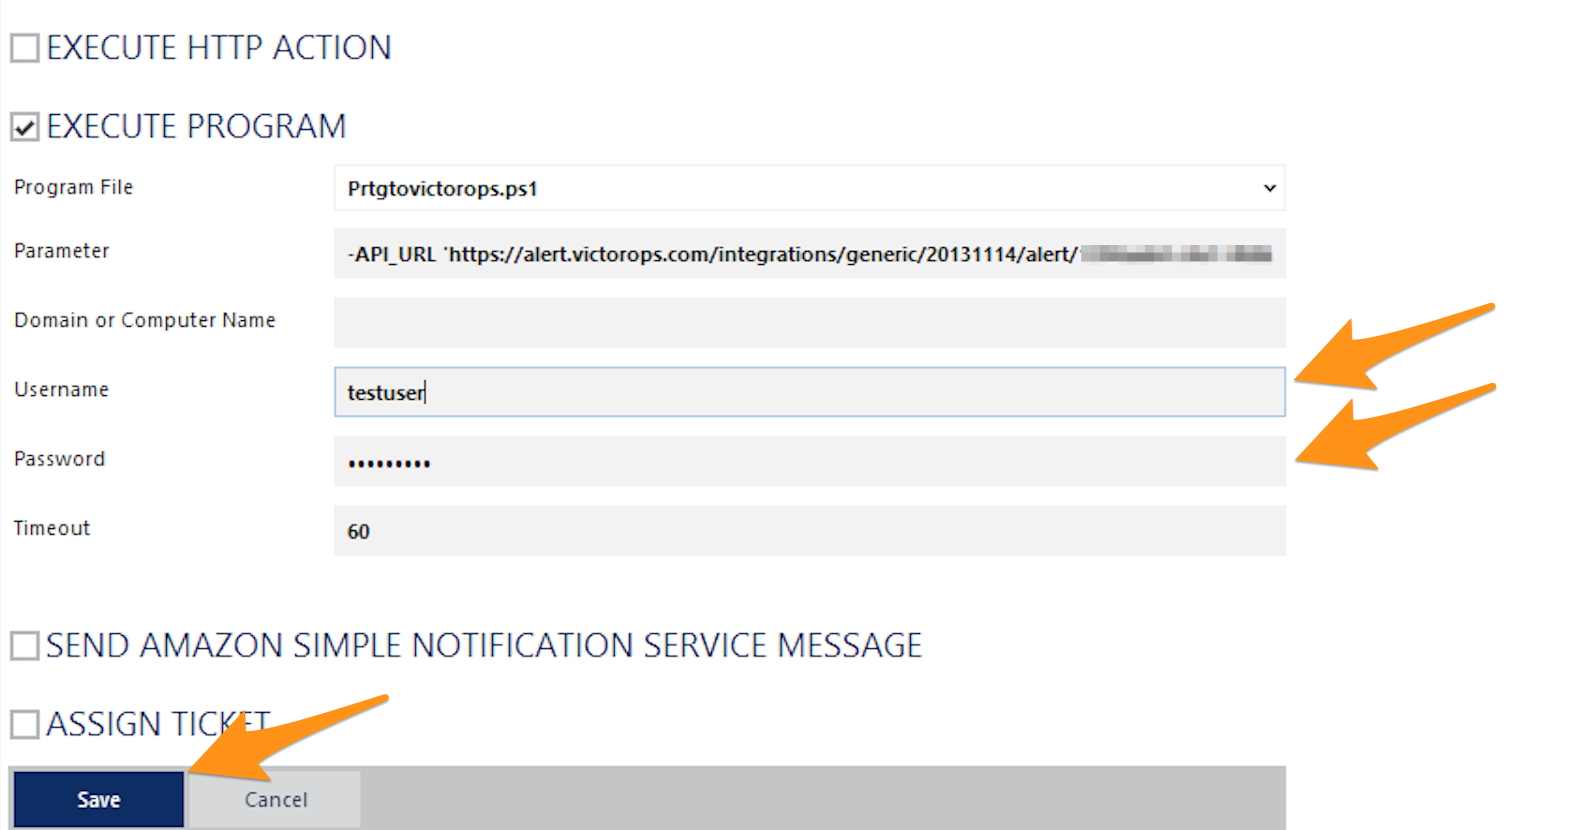
PRTGを最初にインストールしたWindows管理者の認証情報を入力し、Save を選択します。
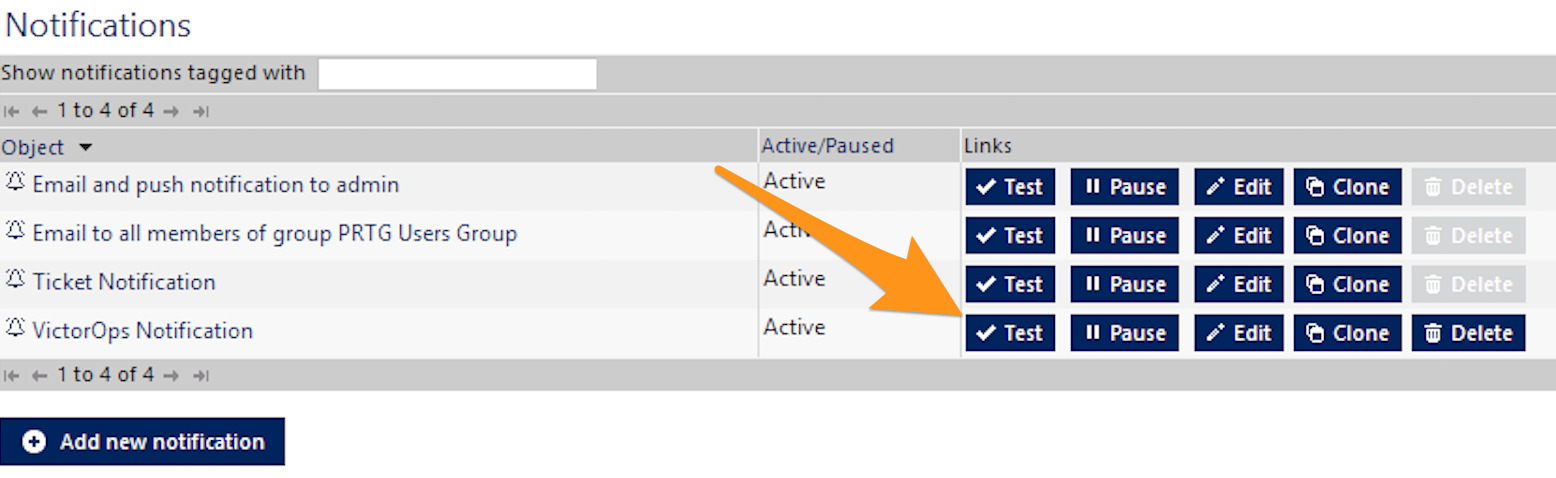
「VictorOps通知」の隣にある Test リンクを選択します。
「通知テスト結果」で OK を選択します。
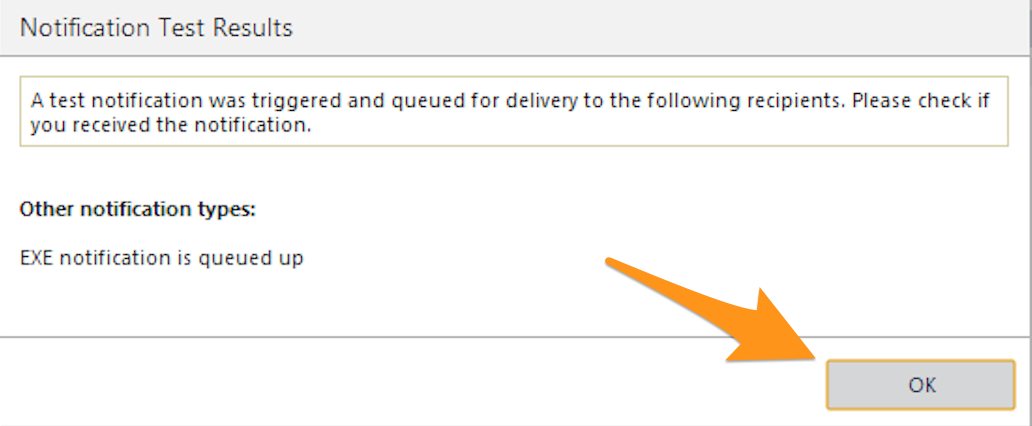
Splunk On-Callタイムラインにアラートが表示されます。
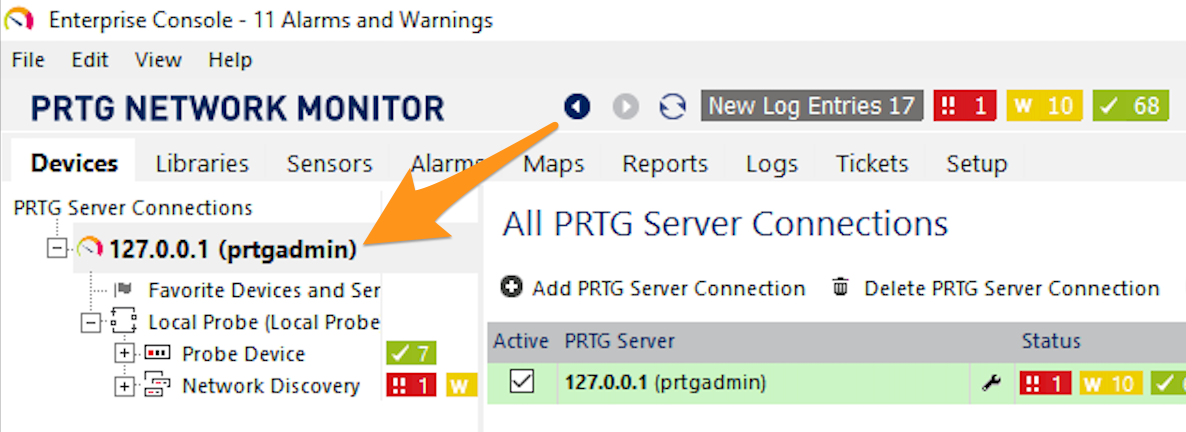
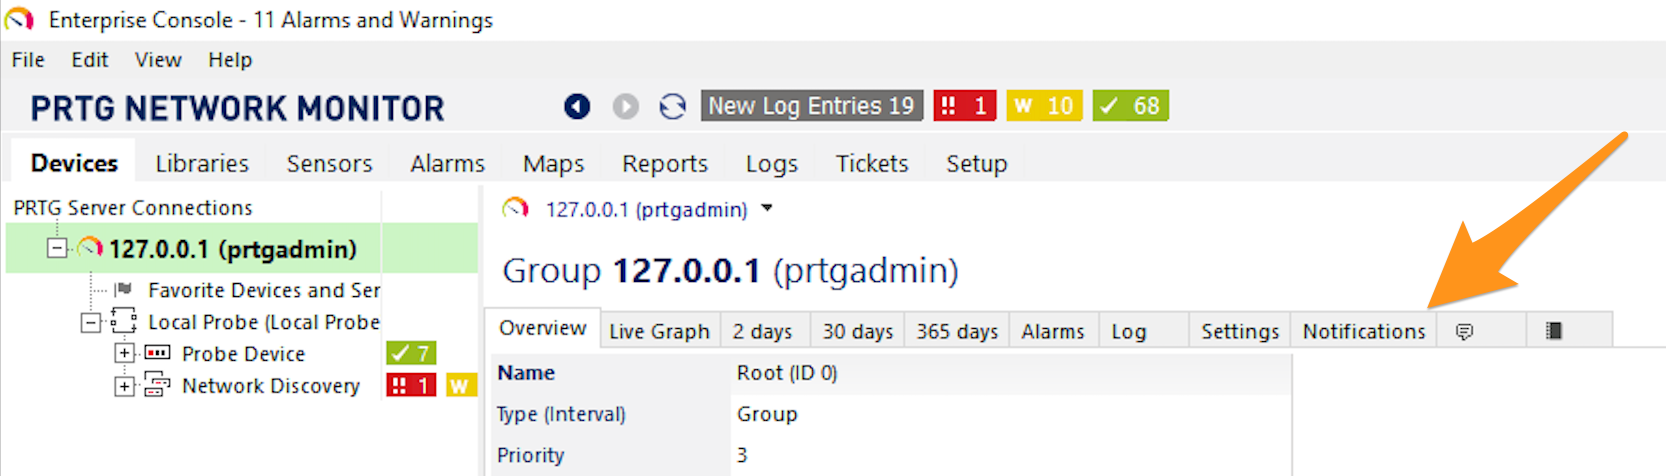
Devices タブを選択します。
親PRTGサーバー接続を選択します。
Notifications タブを選択します。
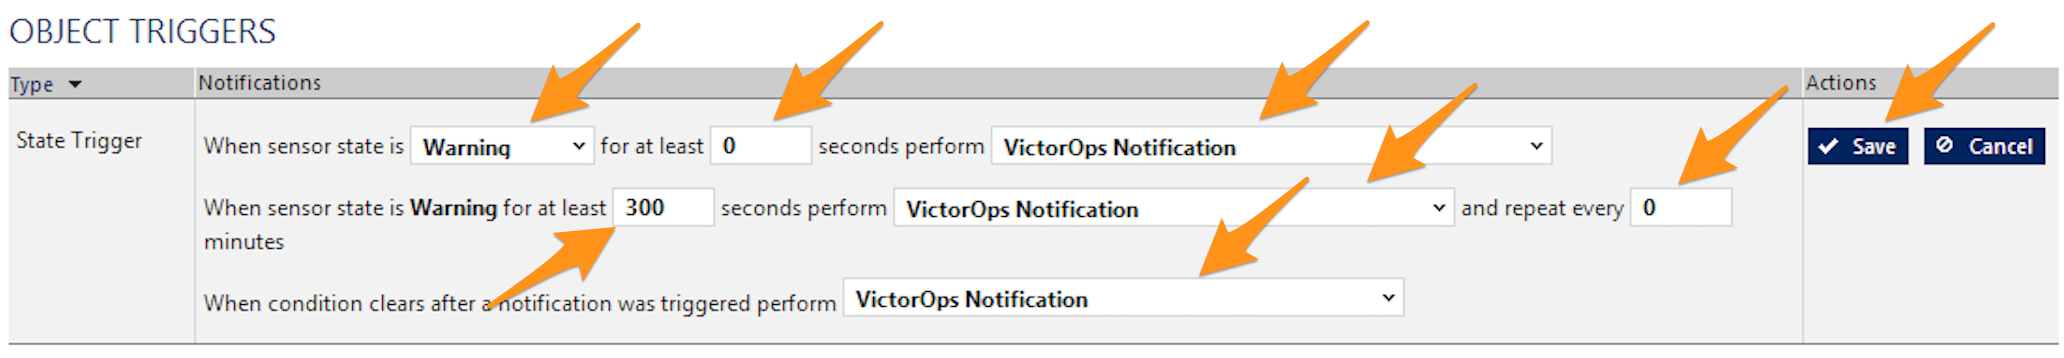
Add State Trigger を選択します。
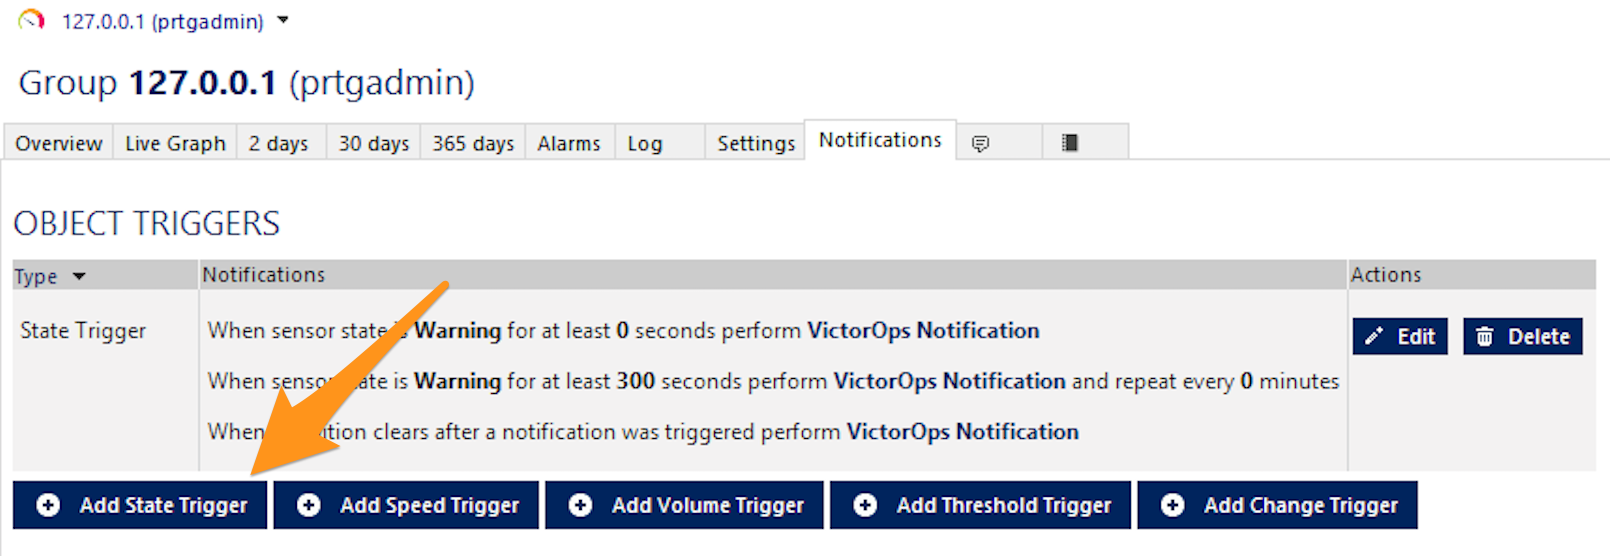
この例では、トリガーは」警告」センサー状態を使用します。これらの設定を変更したり、例えばセンサーが」Down」の時のために他のトリガーを作成したりすることができます。」perform」の後にある3つのドロップダウンメニューから、VictorOps Notification を選択し、Save を選択することを確認してください。
これでこのインテグレーションの設定は完了です。
アラートをシミュレートする 🔗
センサーの1つに移動して選択し、」simulate error status」を選択することで、インテグレーションを確認できます。これによりSplunk On-Callが作成されます。
トラブルシューティング 🔗
インテグレーションスクリプトを最適に動作させるために、最新バージョンのPowershell がPRTG環境で実行されていることを確認してください。現在のPowershellのバージョンは、次のコマンドラインを実行することで確認できます:
$PSVersionTable.PSVersion
ご不明な点がございましたら、Splunk On-Callサポート までお問い合わせください。