Splunk On-CallのNagios CoreとNagios XIインテグレーション 🔗
Splunk On-CallとNagiosのインテグレーションは、Nagios CoreとNagios XIの両方をサポートします。NagiosとSplunk On-Callを統合することで、クラウド、仮想、物理のIT環境を問わず、インフラ全体を監視し、アラートを出すことができます。
Nagiosは、アプリケーション、ネットワーク、およびサーバーリソースの重要なパラメータを定期的にチェックします。それは、例えば、メモリ使用量、ディスク使用量、マイクロプロセッサの負荷、ログファイル、および現在実行中のプロセスの量を監視することができます。Nagiosは、Simple Mail Transfer Protocol (SMTP)、Post Office Protocol 3 (POP3)、Hypertext Transfer Protocol (HTTP)や他の一般的なネットワークプロトコルなどのサービスも監視できます。Nagiosはデータを提供し、アラートをSplunk On-Callタイムラインに送り、そこで問題に対応することができます。
Splunk On-CallとNagiosのインテグレーションは、Splunk On-Callインテグレーション設定にある簡単な自己生成サービスAPIキーで設定可能です。定義されたパラメータとしきい値に基づいて、Nagiosはクリティカルなレベルに達した場合にアラートを送信できます。これらの通知は、ライブコールルーティング、ネイティブチャット、電話、メール、SMSなどの複数のチャネルを通じて、Splunk On-Callの適切なチームに送信できます。
NagiosとSplunk On-Callとのインテグレーションにより、次のことが可能になります:
Splunk On-Call内でサービスAPIキーを生成することにより、Nagiosを簡単に設定できます
アラートを直接Splunk On-Callに送信するようにNagiosを設定します。サービスがクリティカルになると、アラートで適切なチームに通知します
ハートビート情報をSplunk On-Callに送信することで、Nagiosでアラートが生成されていなくても、プラグインが正常に動作しているかどうかを判断できます。Nagiosインテグレーション機能を使用すると、Nagiosサーバーがダウンしている場合でも、Splunk On-Callで情報を収集し、アラートを生成できます。
Splunk On-Callを使用して、Nagiosサーバーでacknoledge backコマンドポールコマンドを実行します。Splunk On-Callで発行されたコマンドは、Nagiosモニターにリレーされます。
Nagios Coreインテグレーションガイド 🔗
要件 🔗
サポートされているNagiosのバージョン:Nagios 4.x以下
必須Splunk On-Callバージョン:Starter、Growth、またはエンタープライズ
ファイアウォールの背後にあるNagios環境については、メールでNagiosアラートを送信する を参照してください
インテグレーションをオンにしてAPIキーを生成する 🔗
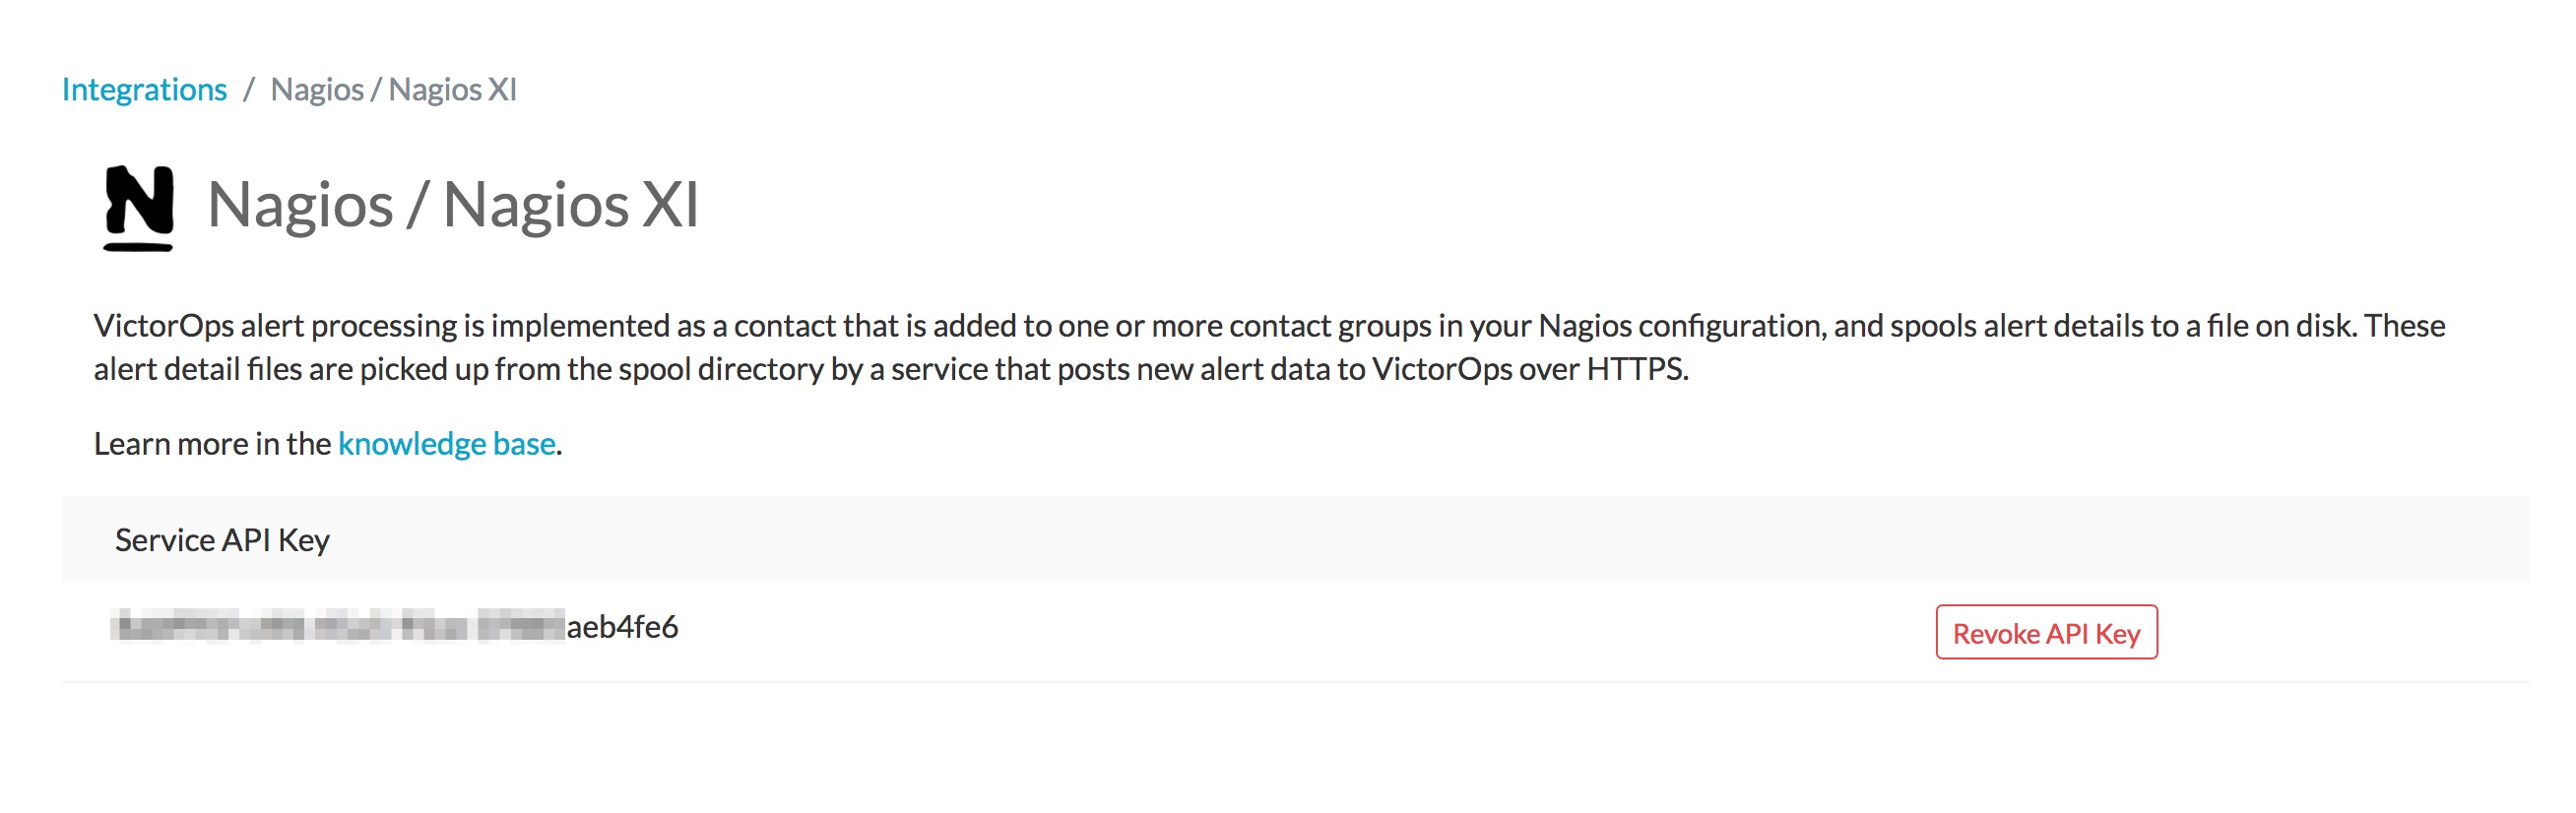
Settings、Alert Behavior、Integrations、Nagios の順に移動して、Enable Integration を選択し、Nagios用の設定値を生成します。インテグレーションをオンにした後に表示されるAPIキーは、後の設定ステップで使用します。
Nagiosプラグインを設定する 🔗
Splunk On-Callアラート処理は、連絡先グループ (多くの場合管理者ですが、これは個々の設定に依存します)に追加されるNagios連絡先として実装されています。Splunk On-Call連絡先の連絡メカニズムは、アラートの詳細をディスク上のファイルにスプールする単純なシェルスクリプトです。アラートが発生し、Nagiosが連絡スクリプトを呼び出すと、詳細は/var/nagiosに置かれ、Nagiosに戻ります。新しいファイルがないか/var/nagiosを監視し、そのファイルのデータをHTTPS経由でSplunk On-Callに転送する長時間実行のbashスクリプトがあります。この転送スクリプトはNagios自身によって監視され、何らかの理由で停止した場合、Nagiosのサービスチェックが再起動を試みます。この転送スクリプトが一時的にSplunk On-Callにアラートを正常に送信できない場合、アラートのメールバージョンの送信にフォールバックします。フォールバックアラートのターゲットアドレスを設定できます。
プラグインをインストールしたくない場合は、メールでNagiosアラートを送信する を参照してください。
プラグインファイルは/opt/victorops/nagios_pluginにインストールされます。victorops.cfgというNagios設定ファイルが/opt/victorops/nagios_plugin/nagios_confにあり、プラグインのすべての設定を含んでいます。
Nagiosプラグインをインストールする 🔗
システムによっては、これらのコマンドでsudoを使う必要がある可能性があります。
以下のコマンドを実行します:
wget https://github.com/victorops/monitoring_tool_releases/releases/download/victorops-nagios-1.4.20/victorops-nagios_1.4.20_all.deb
以下のコマンドを実行します:
dpkg -i <path_to_file>
dpkgを使いたくない場合は、以下を実行することもできます。
sudo apt install <path_to_file>
以下のコマンドを実行します:
wget https://github.com/victorops/monitoring_tool_releases/releases/download/victorops-nagios-1.4.20/victorops-nagios-1.4.20-1.noarch.rpm
以下のコマンドを実行します。
rpm -i <path_to_file>
DEBまたはRPMパッケージからインストールする場合、インストーラはプラグインファイルを/opt/victorops/nagios_pluginに置き、ロギングとアラートディレクトリを作成します。
Nagios設定ファイルを変更する 🔗
インストール後、victorops.cfgファイルをNagios設定ディレクトリに移動し、nagios.cfgとvictorops.cfgファイルの両方を変更する必要があります。
Splunk On-Callへのアラート送信は、Nagios/Icinga環境マクロを必要とするシェルスクリプトを介して行われます。このNagios機能を有効にするには、/etc/nagios/nagios.cfg (またはicinga.cfg。実際のパスは異なる場合があります)を開き、enable_environment_macrosディレクティブを見つけます。これが enable_environment_macros=1 に設定されていることを確認してください。このディレクティブが存在しない場合は、設定ファイルに追加してください。
nagios.cfgファイル内で、独自のファイルパスを使用してSplunk On-Call設定ファイルを見つけるためにNagiosに指示する次の行を追加します。この行は cfg_file=/usr/local/nagios/etc/victorops.cfg のようになります。
VictorOpsの設定ファイルを修正する 🔗
このファイルは、他の変数の中で、Nagiosアラートがどこにルーティングするかを定義します(詳細は下の*インシデントのルーティング*セクションを参照)。
次を使用してファイルをNagios設定ディレクトリに移動する
mv /opt/victorops/nagios_plugin/nagios_conf/victorops.cfg /usr/local/nagios/etc
victorops.cfgファイルを開き、以下の値をVictorOps_Contact_Settings(~行20)の連絡先とVictorOps_Service_Settings(~行40)のサービスオブジェクトの定義として設定します:
必要なコンフィギュレーション設定:
設定
場所
説明
_VO_ORGANIZATION_IDVictorOps_Contact_Settingsのおよそ24行目とVictorOps_Service_Settingsの44行目Splunk On-call組織のスラグ。スラグを見つけるには、Splunk On-Callのタイムラインに移動してURLを見てください。
/client/に続く文字列が_VO_ORGANIZATION_IDです。_VO_ORGANIZATION_KEYVictorOps_Contact_Settingsのおよそ25行目と26行目インテグレーションをオンにしたときに作成されたAPIキー。
VictorOps_Service_Settingsのおよそ51行目この値は
VictorOps_Service_Settingsサービスオブジェクト定義にあります。Nagiosに定義されたNagiosホストの名前です。これはハートビートとコマンドチェックサービスをオンにします。オプションのコンフィギュレーション設定:
設定
場所
説明
_VO_MONITOR_NAMEVictorOps_Contact_Settingsのおよそ24行目とVictorOps_Service_Settingsの46行目Splunk On-Callに対するNagiosインスタンスを識別し、空白の場合もあります。アーキテクチャで複数のNagiosサーバーを使用している場合は、このフィールドに一意のIDを指定して区別します。
_VO_CONTACTEMAILVictorOps_Contact_Settingsのおよそ32行目アラート送信先のバックアップメールアドレス。プラグインがSplunk On-Callにアラートを中継できない場合、このアドレスにアラートメールが送信されます。このリストにemail-SMSゲートウェイを含めます。複数のアドレスを設定するには、たとえばスペースで区切って全体をシングルクォートで囲みます。例:
'me@mydomain.com you@mydomain.com him@mydomain.com 3035551212@vtext.com'_VO_MAX_SEND_DELAYVictorOps_Contact_Settingsのおよそ36行目アラートが連絡先メールに送信される前にキューに残っていることを許可されるアラートの最大時間(秒)。
追加サービスを設定する 🔗
これら4つのサービスは、IcingaサーバーのIcingaダッシュボードに表示されます。これらのサービスのアラートをオンにしたい場合は、victorops.cfgのサービス定義を編集してください。
Splunk On-Callアラートフォワーダー 🔗
これは長時間実行されるスクリプトのプロセスチェックです。このサービスがクリティカルになると、メールアラートが作成されます(このサービスがダウンしているときは、通常のアラート転送は機能しないため)。
Splunk On-Callハートビート 🔗
victorops.cfgファイルは、ハートビート情報をSplunk On-Callに送信するサービスを定義します。このサービスはデフォルトでオンになっています。このサービスは、Nagiosによってアラートが生成されなくても、プラグインが正しく動作しているかどうかを判断するのに役立ちます。
Splunk On-Callコマンドポール (応答を確認) 🔗
このサービスはNagiosサーバーで実行するコマンドをSplunk On-Callにポーリングします。このサービスはデフォルトではオフになっています。目的はSplunk On-Callで発行されたコマンドをNagiosモニターに中継できるようにすることです。現時点では、このサービスで許可されるコマンドはホストとサービスの承認のみです。NagiosのAck-Back を参照してください。
Splunk On-Callステータスの再同期(手動/自動) 🔗
このサービスは完全なNagiosステータスをSplunk On-Callに送ることができます。これはSplunk On-CallがNagiosシステムと同期していない場合に使用できます。例えば、Nagiosで一時的に通知を無効にしていた場合などに発生する可能性があります。NagiosホストにcURLがインストールされている必要があります。手動と自動の2つのオプションがあります。手動オプションはNagiosコンソールで手動でのみ起動できます。autoオプションは自動的に実行されますが、デフォルトではオフにされ、コメントアウトされています。現時点では、これはプレビュー機能です。
インストールの確認 🔗
プラグインをインストールして設定した後、Nagiosを使用して定義したサービスのカスタム通知を送信して機能を確認できます。アラートはSplunk On-Callで受信され、会社のタイムラインに表示されるはずです。
コンタクトスクリプトとアラートフォワーダーは、/var/log/victoropsにログを書き込みます。プラグインが正しく動作していないようであれば、これらのログにエラーがないか確認してください。
インシデントのルーティング 🔗
Splunk On-Call用のNagiosプラグインでは、Splunk On-Callに送信されるルーティングキーは、Splunk On-Callの連絡先を含む連絡先グループの名前です。NagiosでさまざまなインシデントをSplunk On-Callの複数のチームにルーティングできるようにしたい場合は、SplunkOn-Callで使用したいルーティングキーごとに、一意の連絡先と一意の連絡先グループ(1つの連絡先が唯一のメンバー)を作成する必要があります。ルーティングキーはSplunk On-Callで Settings、Alert Behavior、Routing Keys の順に移動してセットアップできます。
次の例では、Nagiosからインシデントを受信したいSplunk On-Callのチームが3つあるとします。チームはDevOps、SRE、データベースです。
victorops.cfgで定義された
VictorOps_Contactsettings設定を使用して、各チームに連絡先を定義します。Devopsの連絡先:
define contact{
use            VictorOps_Contact
name           VictorOps_devops
contact_name   VictorOps_devops
alias          VictorOps_devops
}
SREの連絡先
define contact{
use            VictorOps_Contact
name           VictorOps_sre
contact_name   VictorOps_sre
alias          VictorOps_sre
}
データベースの連絡先
define contact{
use            VictorOps_Contact
name           VictorOps_database
contact_name   VictorOps_database
alias          VictorOps_database
}
上記で定義した連絡先ごとに一意の連絡先グループを定義し、それらの連絡先をそれぞれ唯一のメンバーとして追加します。Splunk On-Callへのアラートで使用される値は
contactgroup_nameに由来するため、これらの名前がSplunk On-Callで使用する値と一致していることを確認するか、Splunk On-Callのrouting_keysをここで定義した名前に一致するように変更してください。Devops連絡先グループ:
define contactgroup{
contactgroup_name         devops ## This is the routing_key value of the alert to Splunk On-Call
alias                     VictorOps DevOps contact group
members                   VictorOps_devops
}
SREの連絡先グループ:
define contactgroup{
contactgroup_name         sre ## This is the routing_key value of the alert to Splunk On-Call
alias                     VictorOps SRE contact group
members                   VictorOps_sre
}
データベースの連絡先グループ:
define contactgroup{
contactgroup_name         database ## This is the routing_key value of the alert to Splunk On-Call
alias                     VictorOps Database contact group
members                   VictorOps_database
}
連絡先グループを適切なチェックコマンドに追加して、正しいルーティングキー(contactgroup_name)で届くようにします。いくつでも好きなだけ多くのcontact_groupsにVictorOps連絡先を追加でき、特定のサービスにVictorOps連絡先を追加することもできます。
メールでNagiosアラートを送信する 🔗
Nagios環境がファイアウォールで制限されている場合、またはNagiosホストにプラグインをインストールしたくない場合でも、メールを通してSplunk On-CallにNagiosアラートを送ることができます。メールで送信されたアラートは、プラグインによって提供される拡張機能なしでタイムラインに表示されます。
NagiosアラートをメールでSplunk On-Callに送信するには、以下のサンプル設定を使用してNagiosコンタクトを作成し、そのコンタクトを通常システムからのアラートを受信するNagiosコンタクトグループの1つに追加します。
サンプル構成では、組織IDと組織キーによってSplunk On-Callがアラートを検証し、タイムラインにルーティングします。値はSplunk On-Call Webアプリのインテグレーションセクションで確認できます。設定内のmailコマンドは、アラートの詳細をアラートメールに適切にフォーマットします。
##——————————————————————————————
## These Nagios contact and service definitions are used to pass configurable values to the email command.
##
## Contact settings:
## _VO_ORGANIZATION_ID
## _VO_ORGANIZATION_KEY
## These identify your alerts to VictorOps. The values for these fields are assigned to you by VictorOps.
## _VO_MONITOR_NAME
## VictorOps supports multiple Nagios instances per organization. This configuration value identifies the instance to
## VictorOps. It can be set to something you choose (such as the name of this Nagios host).
##
##——————————————————————————————

define contact{
   contact_name VictorOps_Email
   ## Configure these values as described above
   _VO_ORGANIZATION_ID xxxxxxxxxxxxx
   _VO_ORGANIZATION_KEY xxxxxxxx-xxxx-xxxx-xxxx-xxxxxxxxxxxx
   _VO_MONITOR_NAME

   alias    VictorOps_Email
   service_notification_period    24x7
   host_notification_period    24x7
   service_notification_options    w,u,c,r
   host_notification_options    d,r
   service_notification_commands    notify-victorops-by-email
   host_notification_commands    notify-victorops-by-email
   register    1
   _VO_ALERT_DOMAIN    alert.victorops.com

}

define command{
   command_name notify-victorops-by-email
   command_line /usr/bin/printf "%b" "\nVO_ORGANIZATION_ID=$_CONTACTVO_ORGANIZATION_ID$\nVO_ ORGANIZATION_KEY=$_CONTACTVO_ORGANIZATION_KEY$\n_CONTACTVO_ORGANIZATION_KEY=$_CONTACTVO_ORGANIZATION_KEY$\nVO_MONITOR_NAME=$_CONTACTVO_MONITOR_NAME$\n_CONTACTVO_MONITOR_NAME=$_CONTACTVO_MONITOR_NAME$\nTIMET=$TIMET$\nDATE=$DATE$\nTIME=$TIME$\nHOSTNAME=$HOSTNAME$\nHOSTALIAS=$HOSTALIAS$\nHOSTDISPLAYNAME=$HOSTDISPLAYNAME$\nHOSTSTATE=$HOSTSTATE$\nLASTHOSTSTATECHANGE=$LASTHOSTSTATECHANGE$\nHOSTOUTPUT=$HOSTOUTPUT$\nHOSTPERFDATA=$HOSTPERFDATA$\nHOSTGROUPALIAS=$HOSTGROUPALIAS$\nHOSTGROUPNAME=$HOSTGROUPNAME$\nHOSTGROUPMEMBERS=$HOSTGROUPMEMBERS$\nHOSTGROUPNAMES=$HOSTGROUPNAMES$\nSERVICEDESC=$SERVICEDESC$\nSERVICEDISPLAYNAME=$SERVICEDISPLAYNAME$\nSERVICESTATE=$SERVICESTATE$\nLASTSERVICESTATECHANGE=$LASTSERVICESTATECHANGE$\nSERVICEOUTPUT=$SERVICEOUTPUT$\nSERVICECHECKCOMMAND=$SERVICECHECKCOMMAND$\nCONTACTGROUPNAME=$CONTACTGROUPNAME$\nNOTIFICATIONTYPE=$NOTIFICATIONTYPE$\nNOTIFICATIONAUTHOR=$NOTIFICATIONAUTHOR$\nNOTIFICATIONCOMMENT=$NOTIFICATIONCOMMENT$\n" | /usr/bin/mail -s "$_CONTACTVO_ORGANIZATION_ID$:$_CONTACTVO_ORGANIZATION_KEY$:$_CONTACTVO_MONITOR_NAME$" $_CONTACTVO_ORGANIZATION_KEY$@$_CONTACTVO_ALERT_DOMAIN$
}
Centos 5のタイムアウトを回避する 🔗
timeoutコマンドをパス内のディレクトリにリンクさせる必要があります。
シンボリックリンクを作成します。
ln -s /usr/share/doc/bash-3.2/scripts/timeout /usr/bin/timeout
実行可能にします:
chmod 755 /usr/share/doc/bash-3.2/scripts/timeout
Nagios XIインテグレーションガイド 🔗
要件 🔗
サポートされているNagiosのバージョン:Nagios XI 5.x以下
必須VictorOpsバージョン:Starter、Growth、またはエンタープライズ
Nagiosプラグインをインストールする 🔗
システムによっては、これらのコマンドでsudoを使う必要がある可能性があります。
以下のコマンドを実行します:
wget https://github.com/victorops/monitoring_tool_releases/releases/download/victorops-nagios-1.4.20/victorops-nagios_1.4.20_all.deb
以下のコマンドを実行します:
dpkg -i <path_to_file>
dpkgを使いたくない場合は、以下を実行することもできます。
sudo apt install <path_to_file>
以下のコマンドを実行します:
wget https://github.com/victorops/monitoring_tool_releases/releases/download/victorops-nagios-1.4.20/victorops-nagios-1.4.20-1.noarch.rpm
以下のコマンドを実行します。
rpm -i <path_to_file>
DEBまたはRPMパッケージからインストールする場合、インストーラはプラグインファイルを/opt/victorops/nagios_pluginに置き、ロギングとアラートディレクトリを作成します。
環境マクロを有効にする 🔗
アラートは、Nagios環境マクロを必要とするシェルスクリプトを使用してSplunk On-Callに送信されます。このNagios機能を有効にするには、/etc/nagios/nagios.cfg** (実際のパスは異なる場合があります)で enable_environment_macros ディレクティブを見つけ、それが 1 に設定されていることを確認します。このディレクティブが存在しない場合は、設定ファイル enable_environment_macros=1 に追加します。
設定をインポートする 🔗
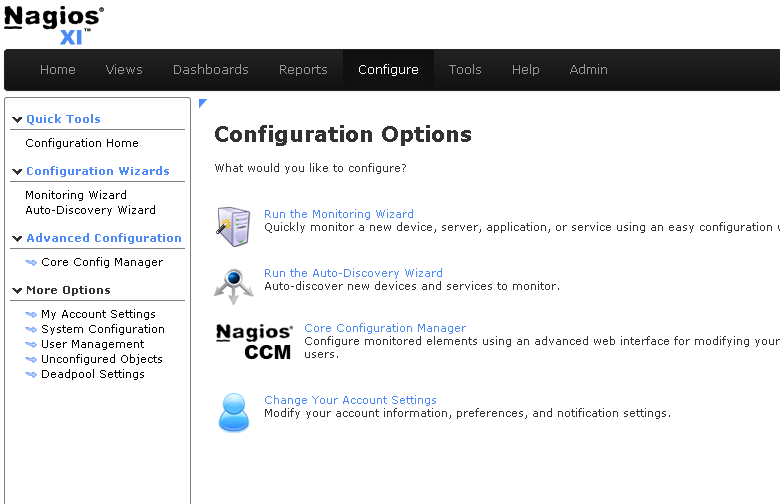
Nagios XIダッシュボードで、トップメニューの Configure を選択します。
Core Config Manager を選択します。
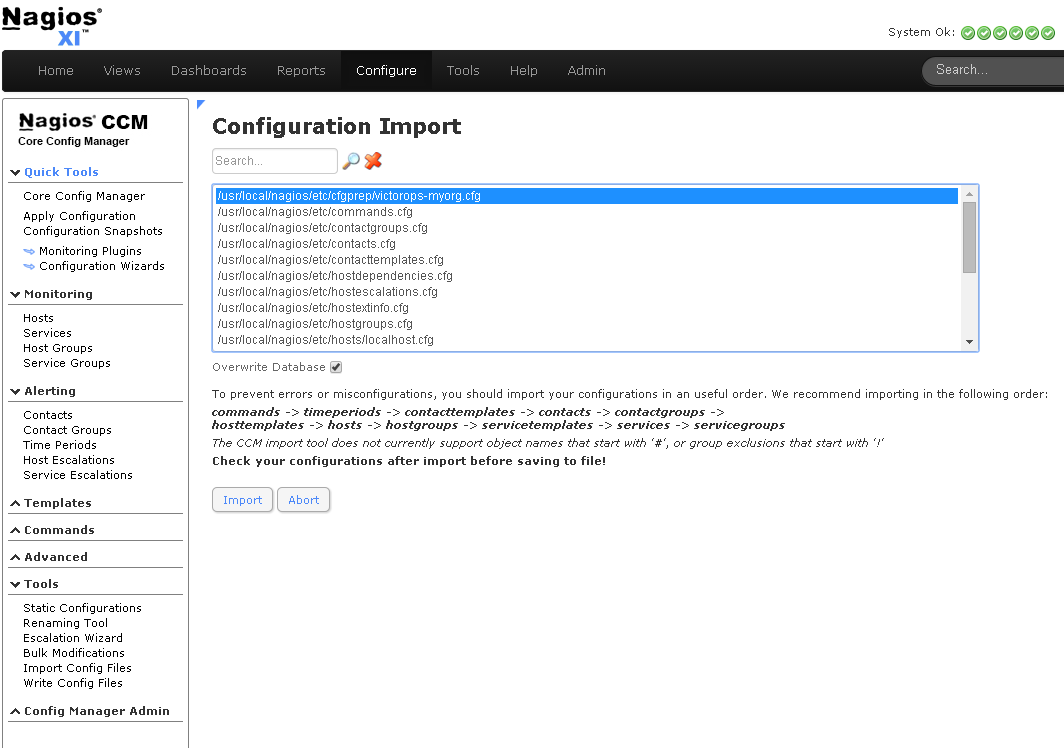
Tools を選択し、次に Import Config Files を選択します。
ファイルリストから設定を選択します。
Import を選択します。
Nagios XIはSplunk On-Callサービスのチェックコマンドを 「misc command 「としてインポートします。Nagios XI UIでacknowlege backを有効にするには、サービスを 「check command 「に変更する必要があります。Core Config Manager に移動して、コマンドのリストを表示します。
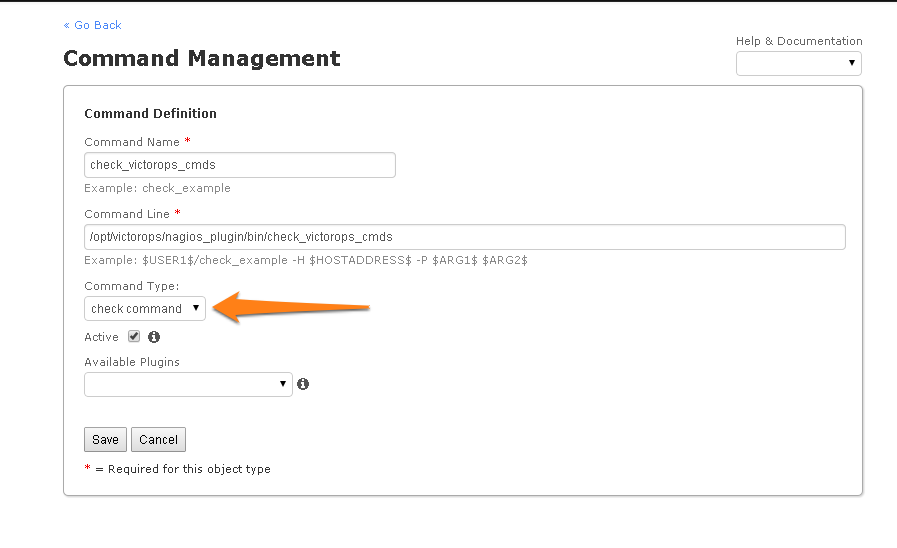
「check_victorops_cmds」コマンドのconfigureアイコンを選択します。
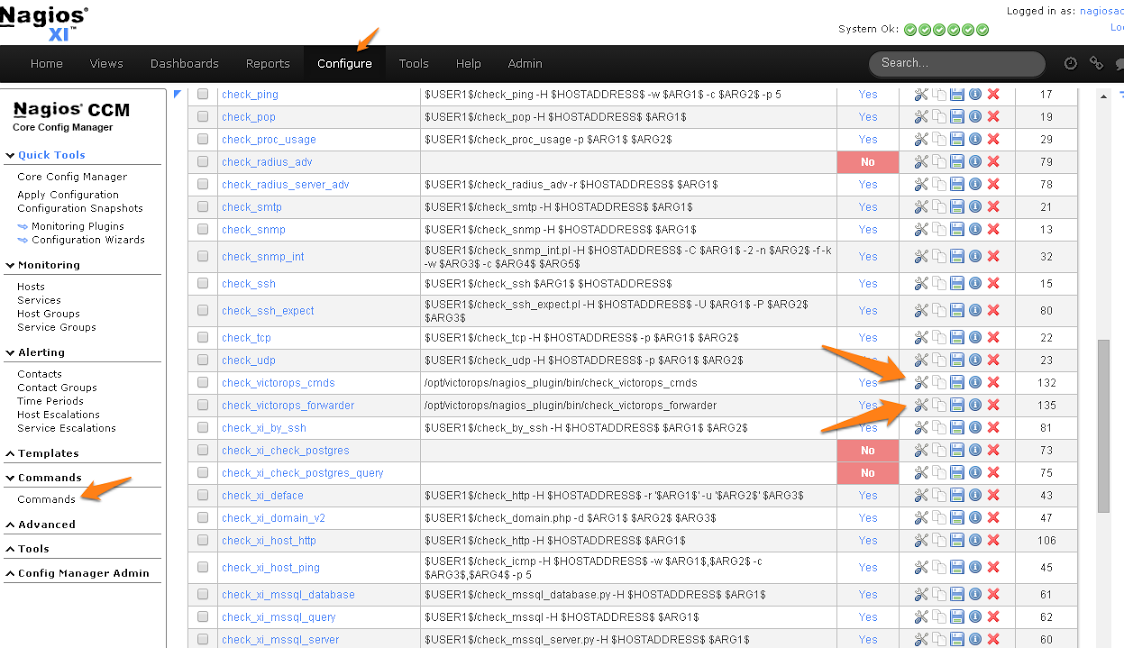
ダイアログボックスで、コマンドタイプを「checkコマンド」に変更し、保存します。
Splunk On-Callにアラートを送信する 🔗
Nagios XIインターフェイスを通して、」VictorOps Command Poll 「サービスのアクティブチェックを有効にすることができるようになりました。
アラートが届かない場合は、/opt/victorops/nagios_plugin/nagios_conf/victorops.cfgファイルをコピーして、/usr/local/nagios/etc/cfgprep/victorops.cfgに配置してみてください。
「Duplicate definition found for contact 『VictorOps_Contact_Settings『「というエラーが表示された場合は、nagios.cfgから cfg_file=/usr/local/nagios/etc/victorops.cfg 行を削除してください。